I. Intro
Date: 04/19/2023
This project will simulate real problems from gathering data to outputting results with everything we have learned so far. DJI Mavic 2 Pro, Pix4D Mapping, and ArcGIS Pro were used.
II. Gathering Data
A. Site and Weather Conditions
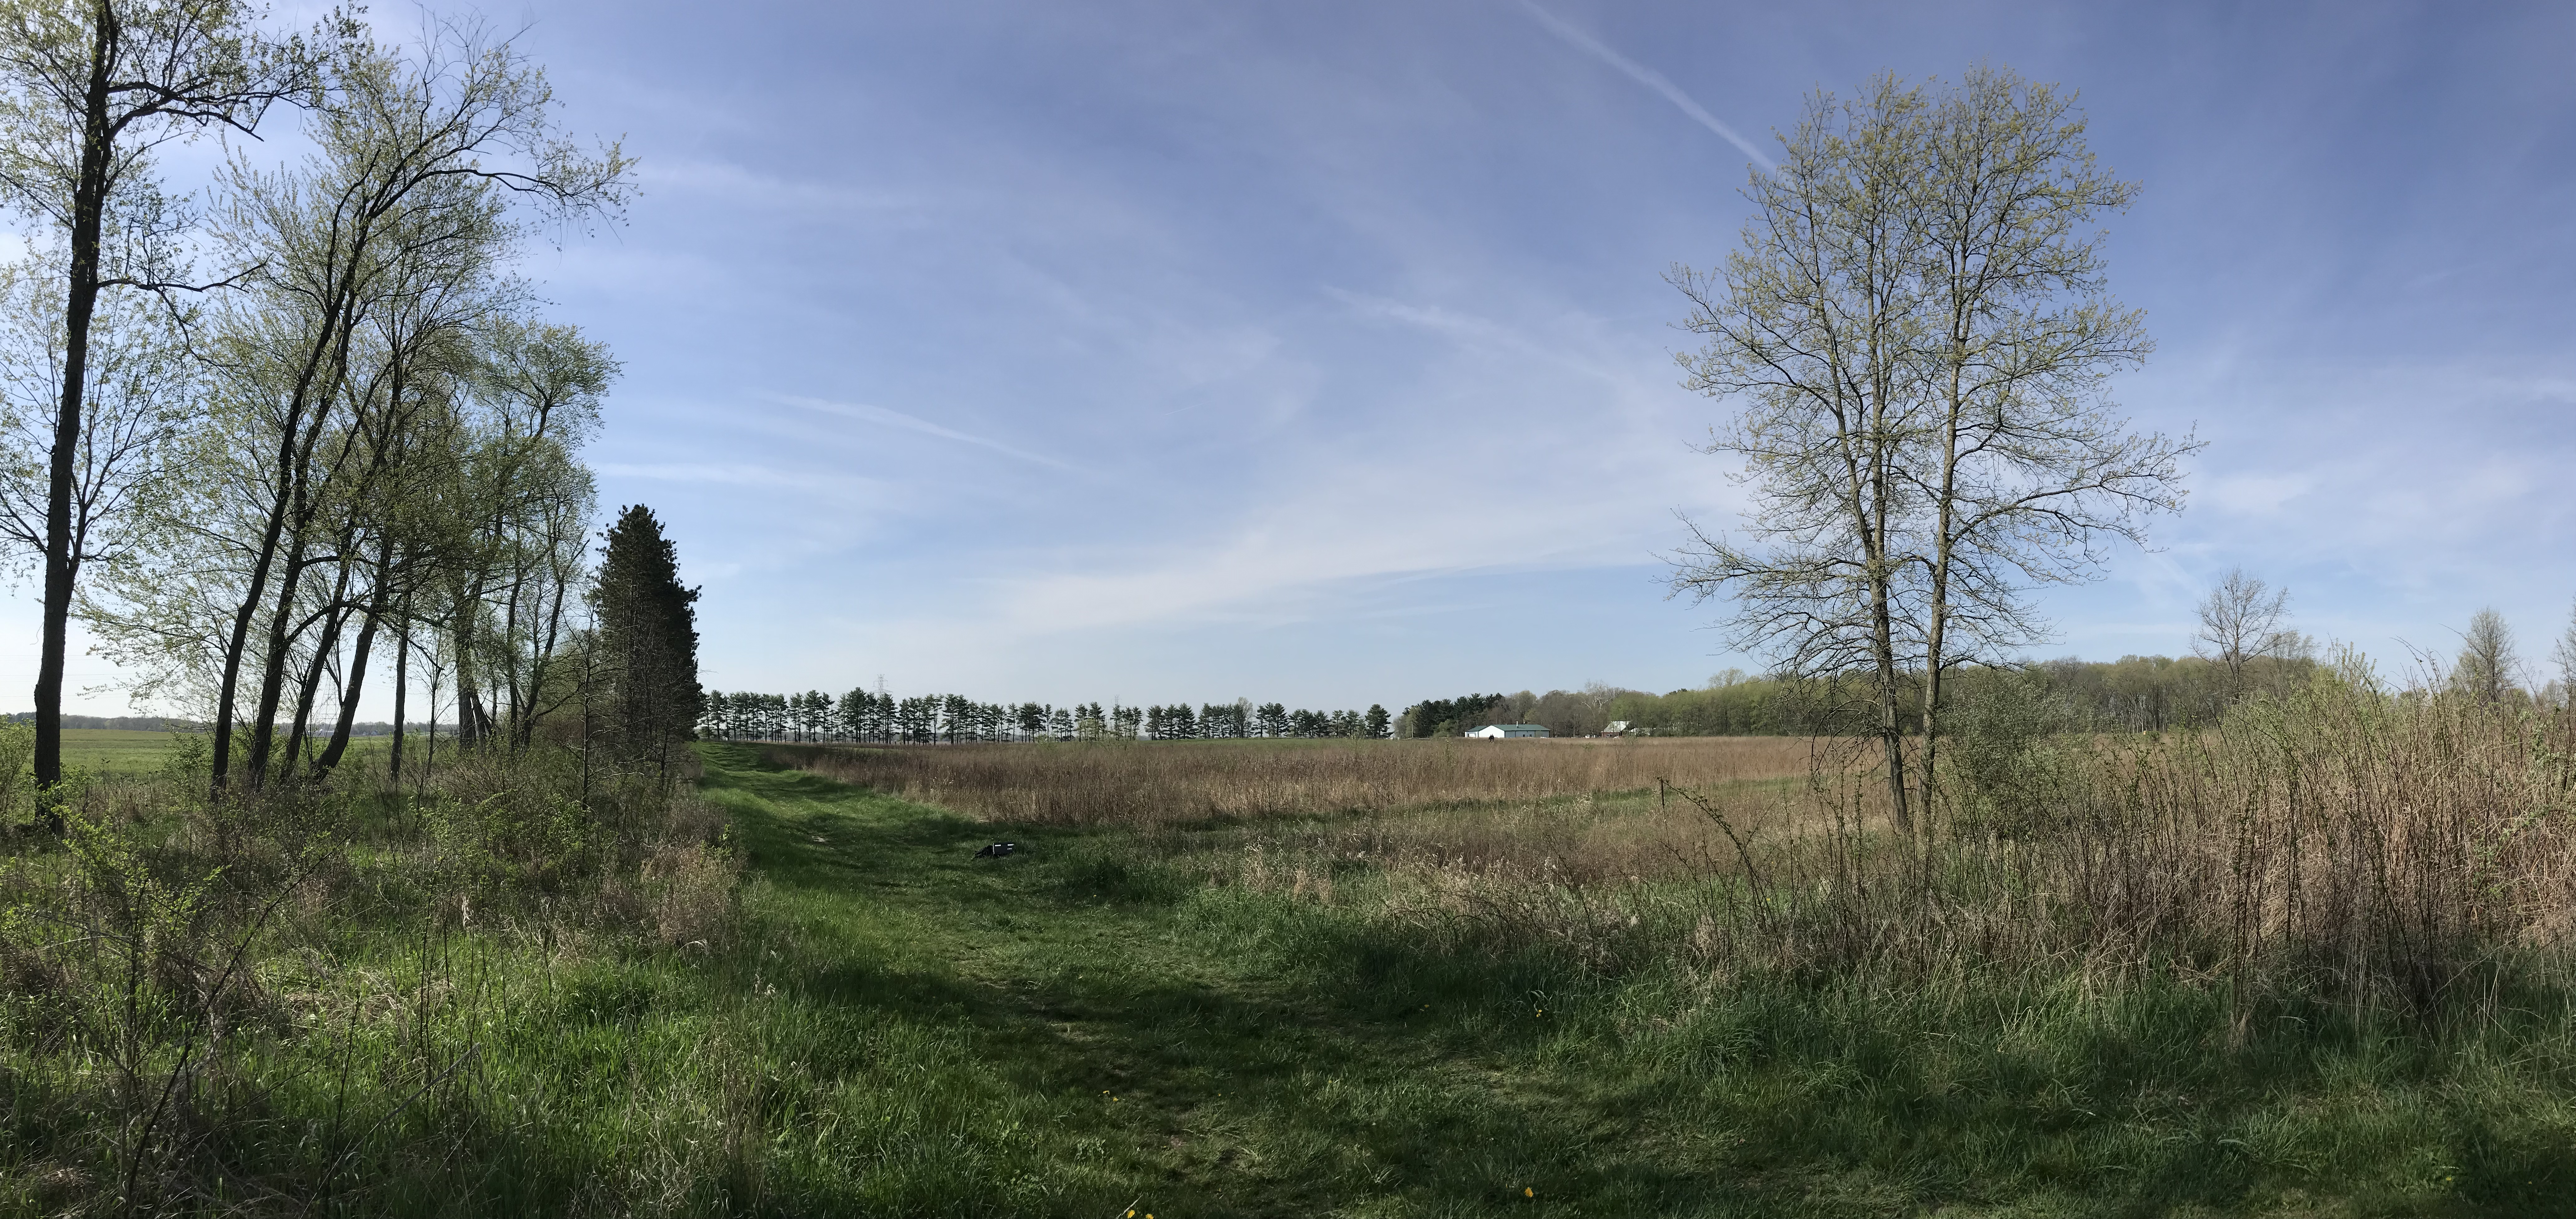
Site Condition:
Weather Condition:
- Cloud Cover: 5%
- Wind Direction: SE
- Wind Speed: 11 km/h
- Temp: 15 deg C
B. Flight and Mission Information
a. Flight Information:3
- Location: PWA
- Date: 04/19/2023
- Vehicle: Mavic 2 Pro AI
- Sensor:DJI Mavic 2 Pro Camera
- Battery: Mavic 2 Pro
- Flight Number: 1
- Takeoff Time: 10:57
- Landing Time: 1118
- Altitude (m): 120
- Sensor Angle: 80
- Overlap: 80%
- Sidelap: 80%
b. Crew
- PIC: Dingming Lu
- VO: Karl Oversteyns
C. GCP Placement and Collection
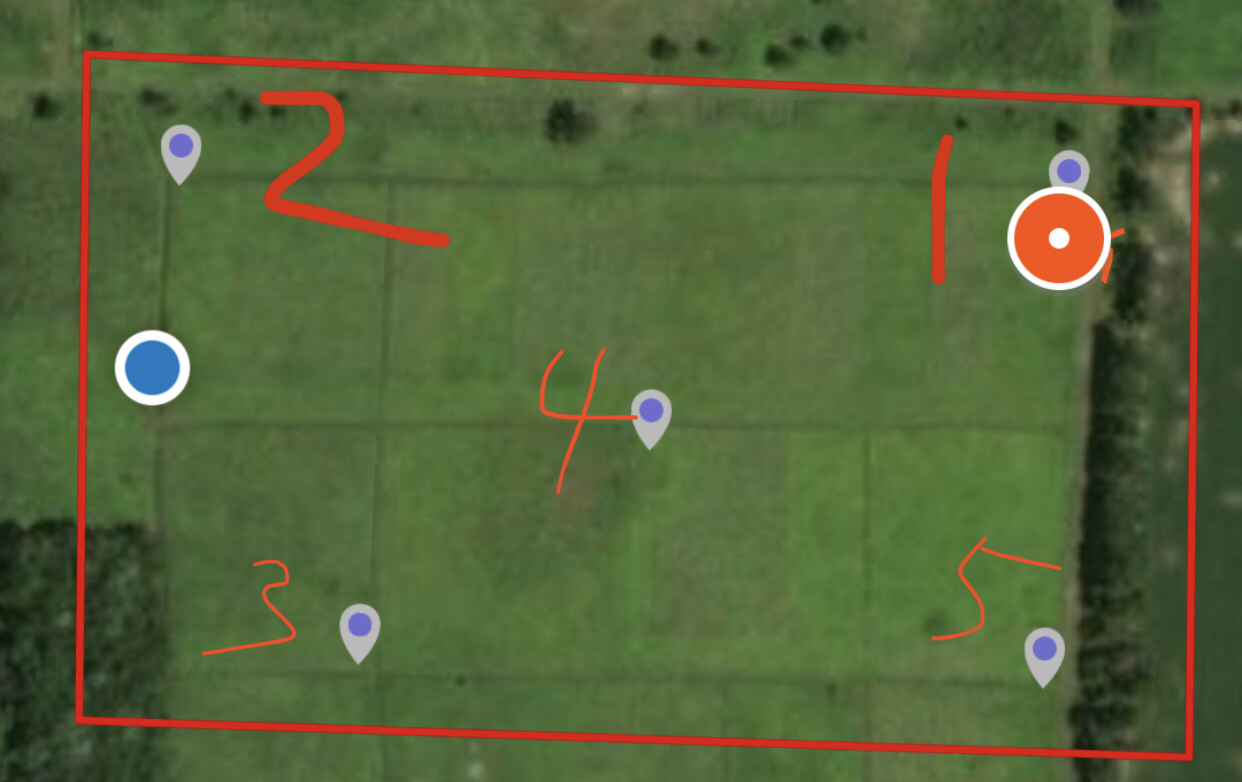
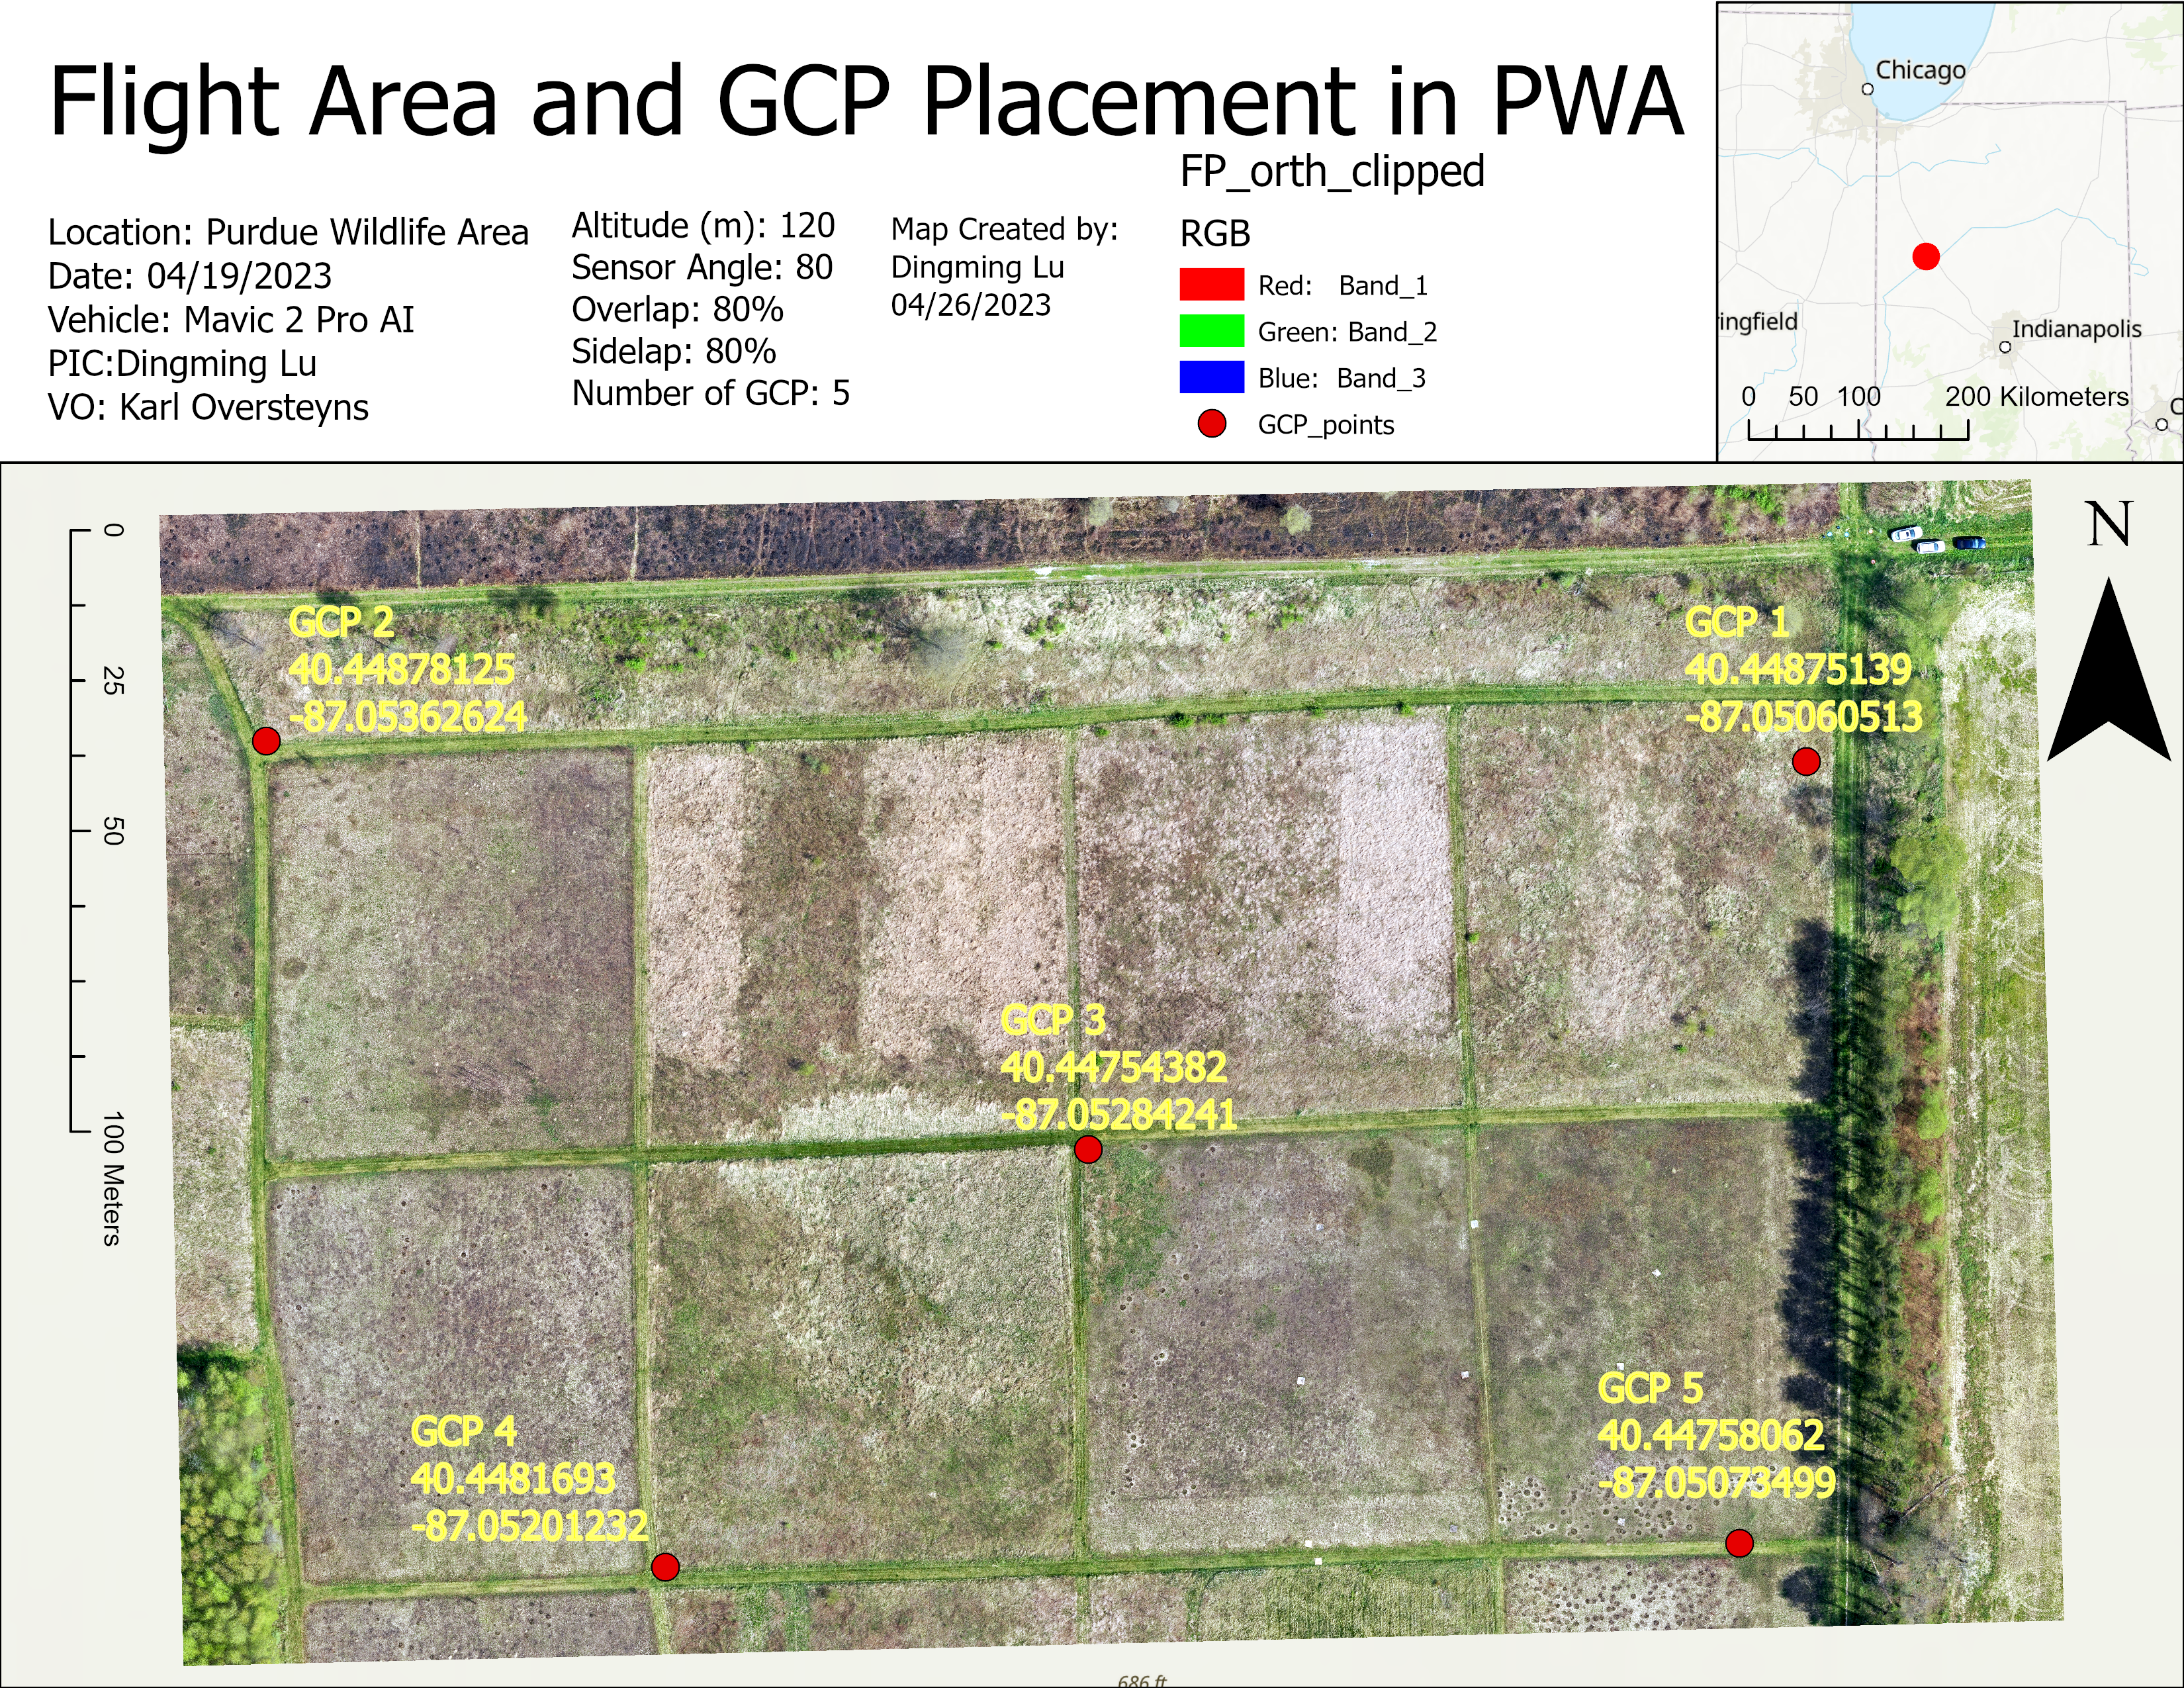
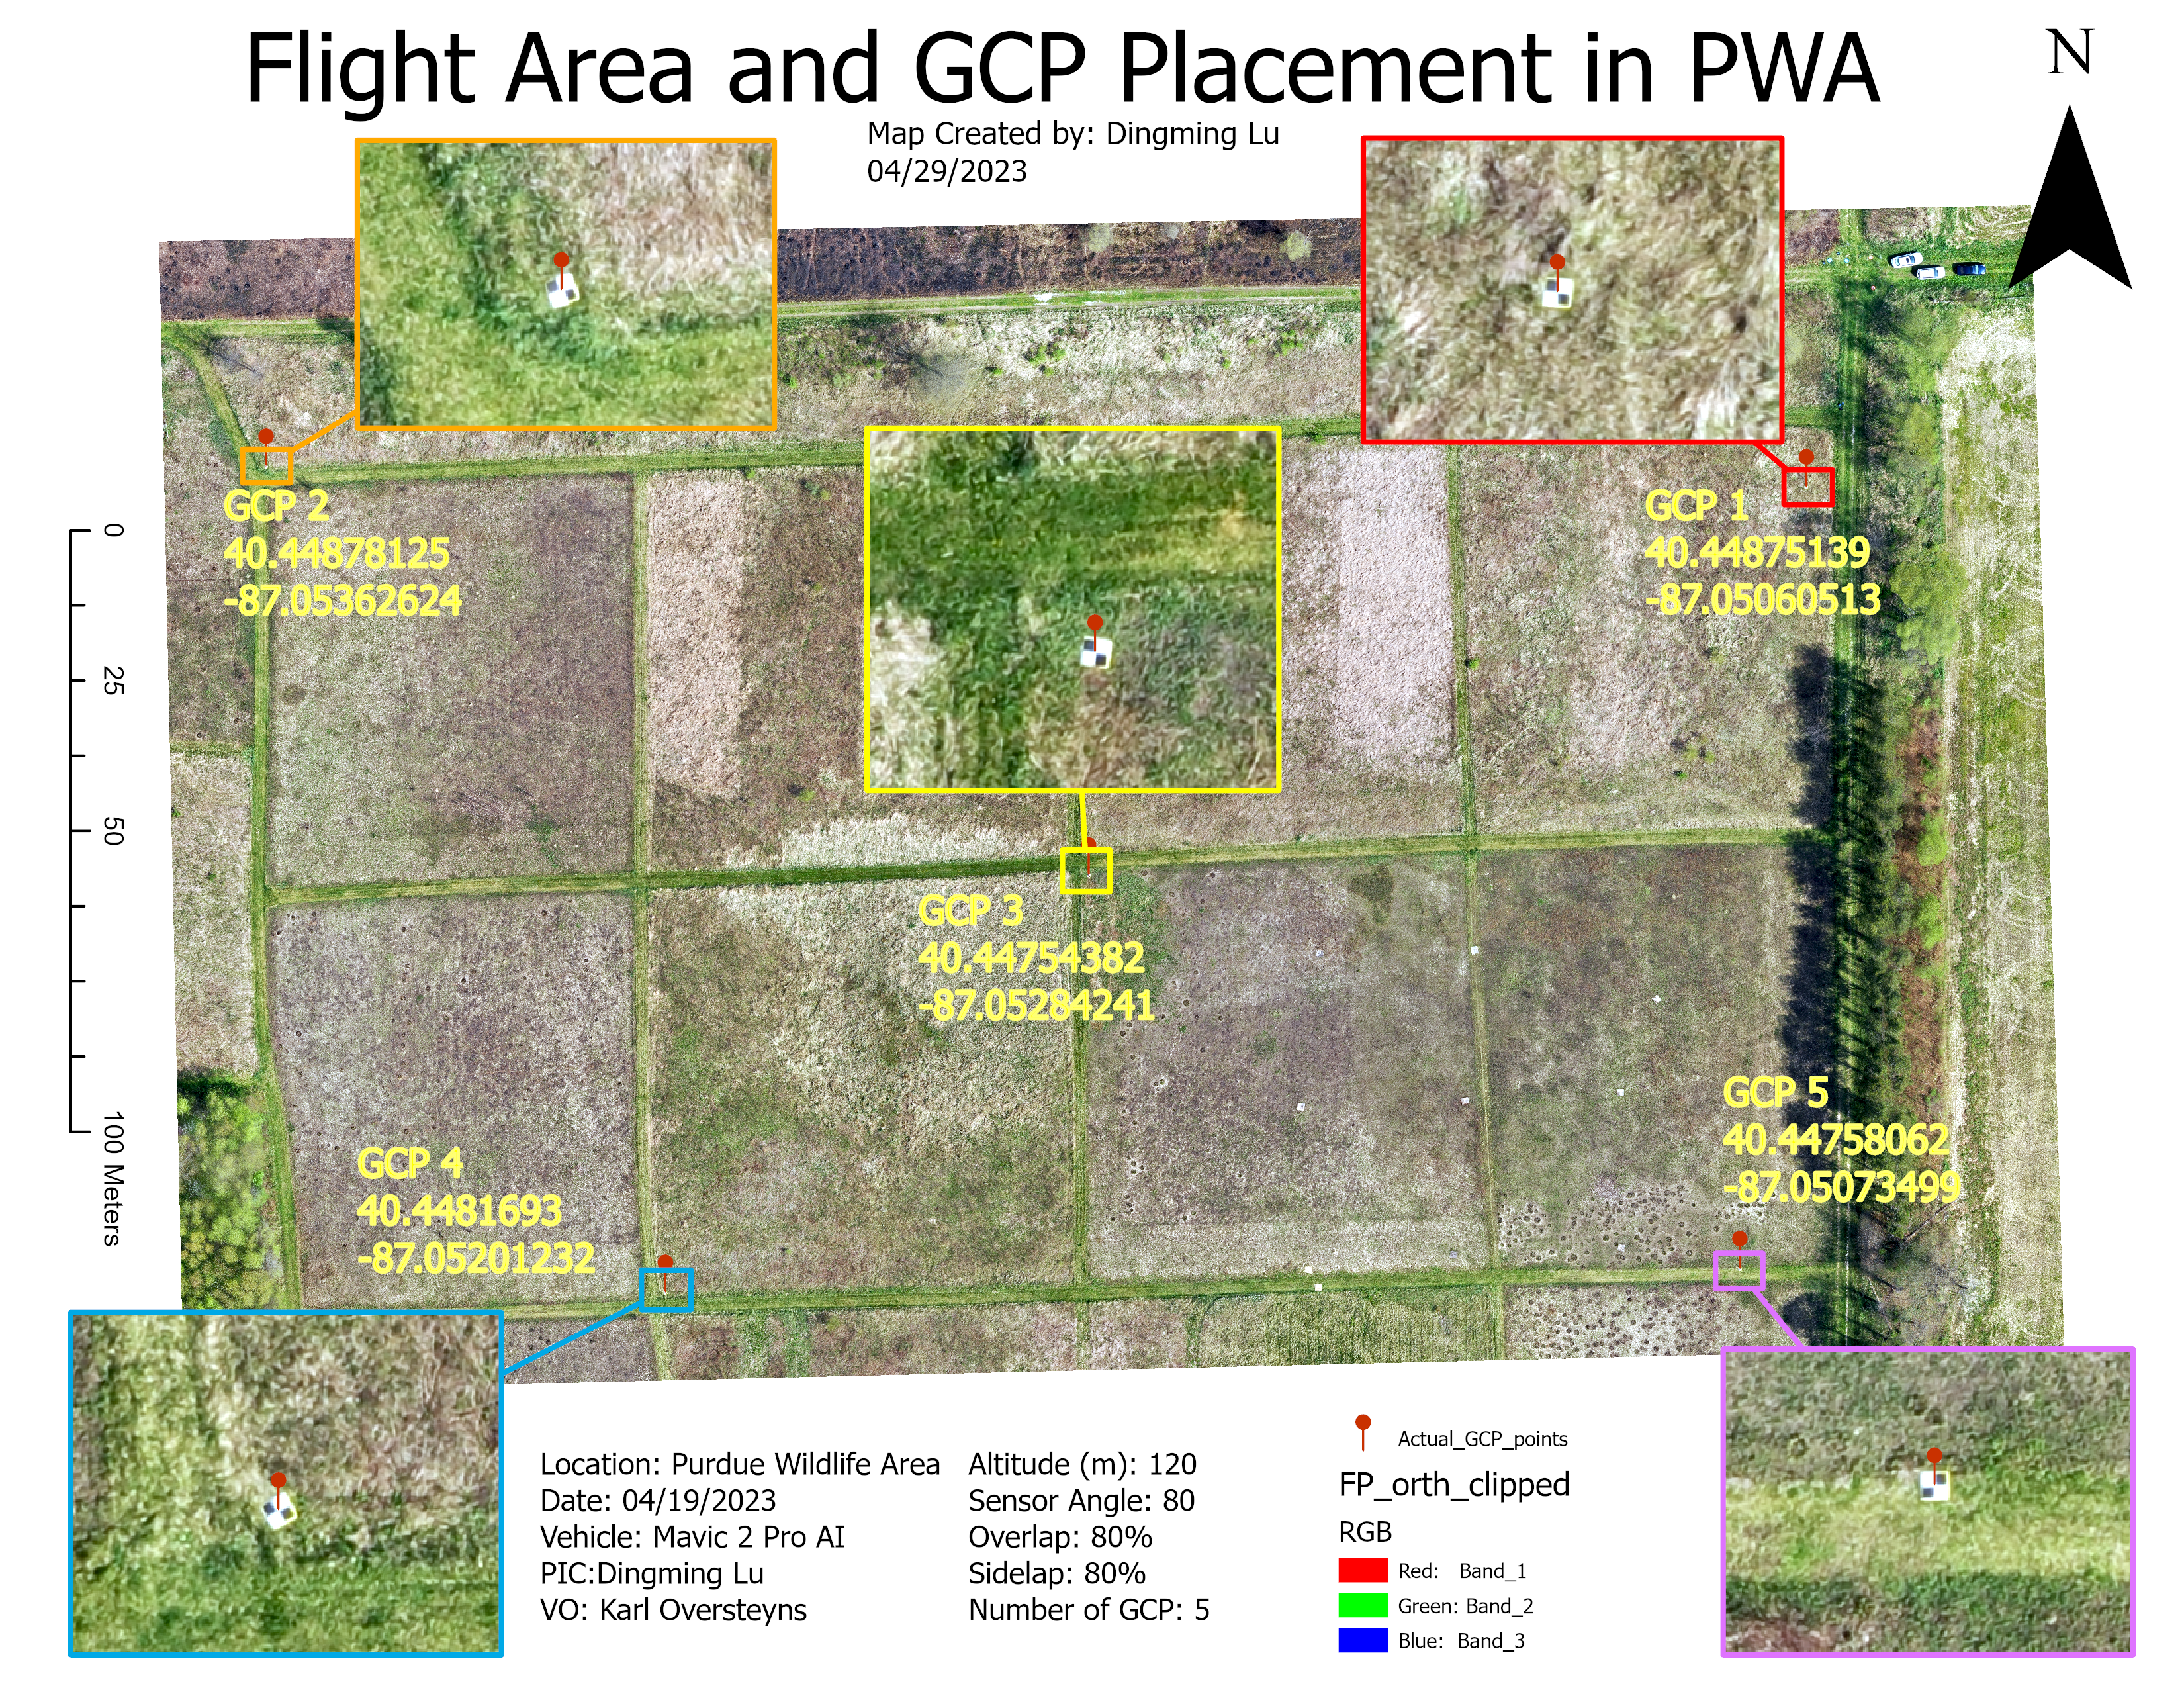
Five Aeropoint GCPs were used. They were placed and turned on with an order of 1, 2, 3, 4, 5, then turned off and picked up with 5, 4, 3, 2, 1. Then we open a hot spot at the field and uploaded the data to the server.
Go to Appendix Section A to see actual GCP placement in the field.
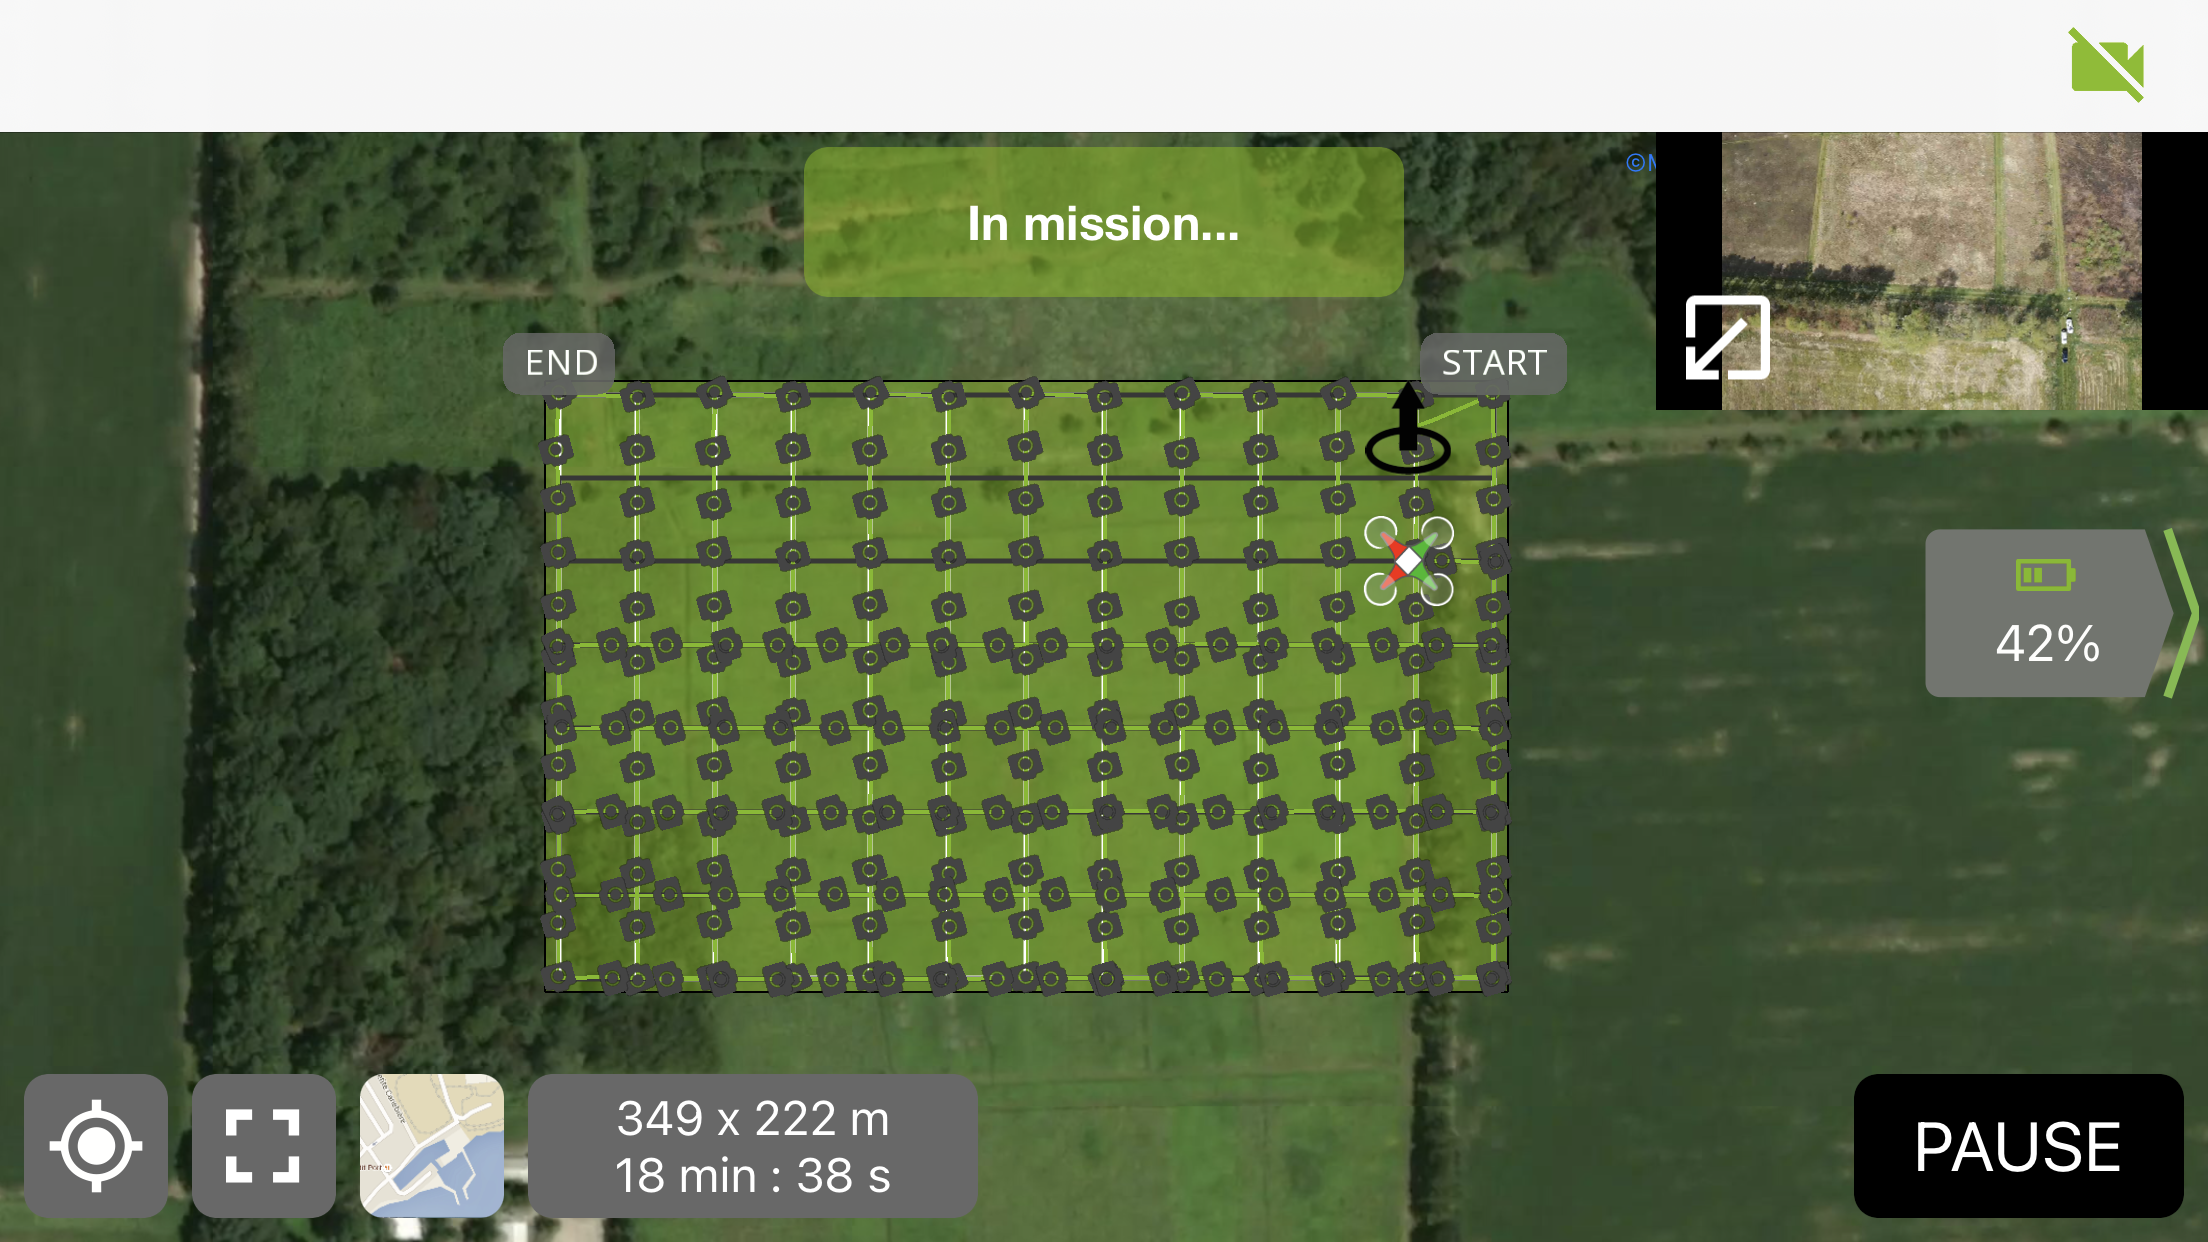
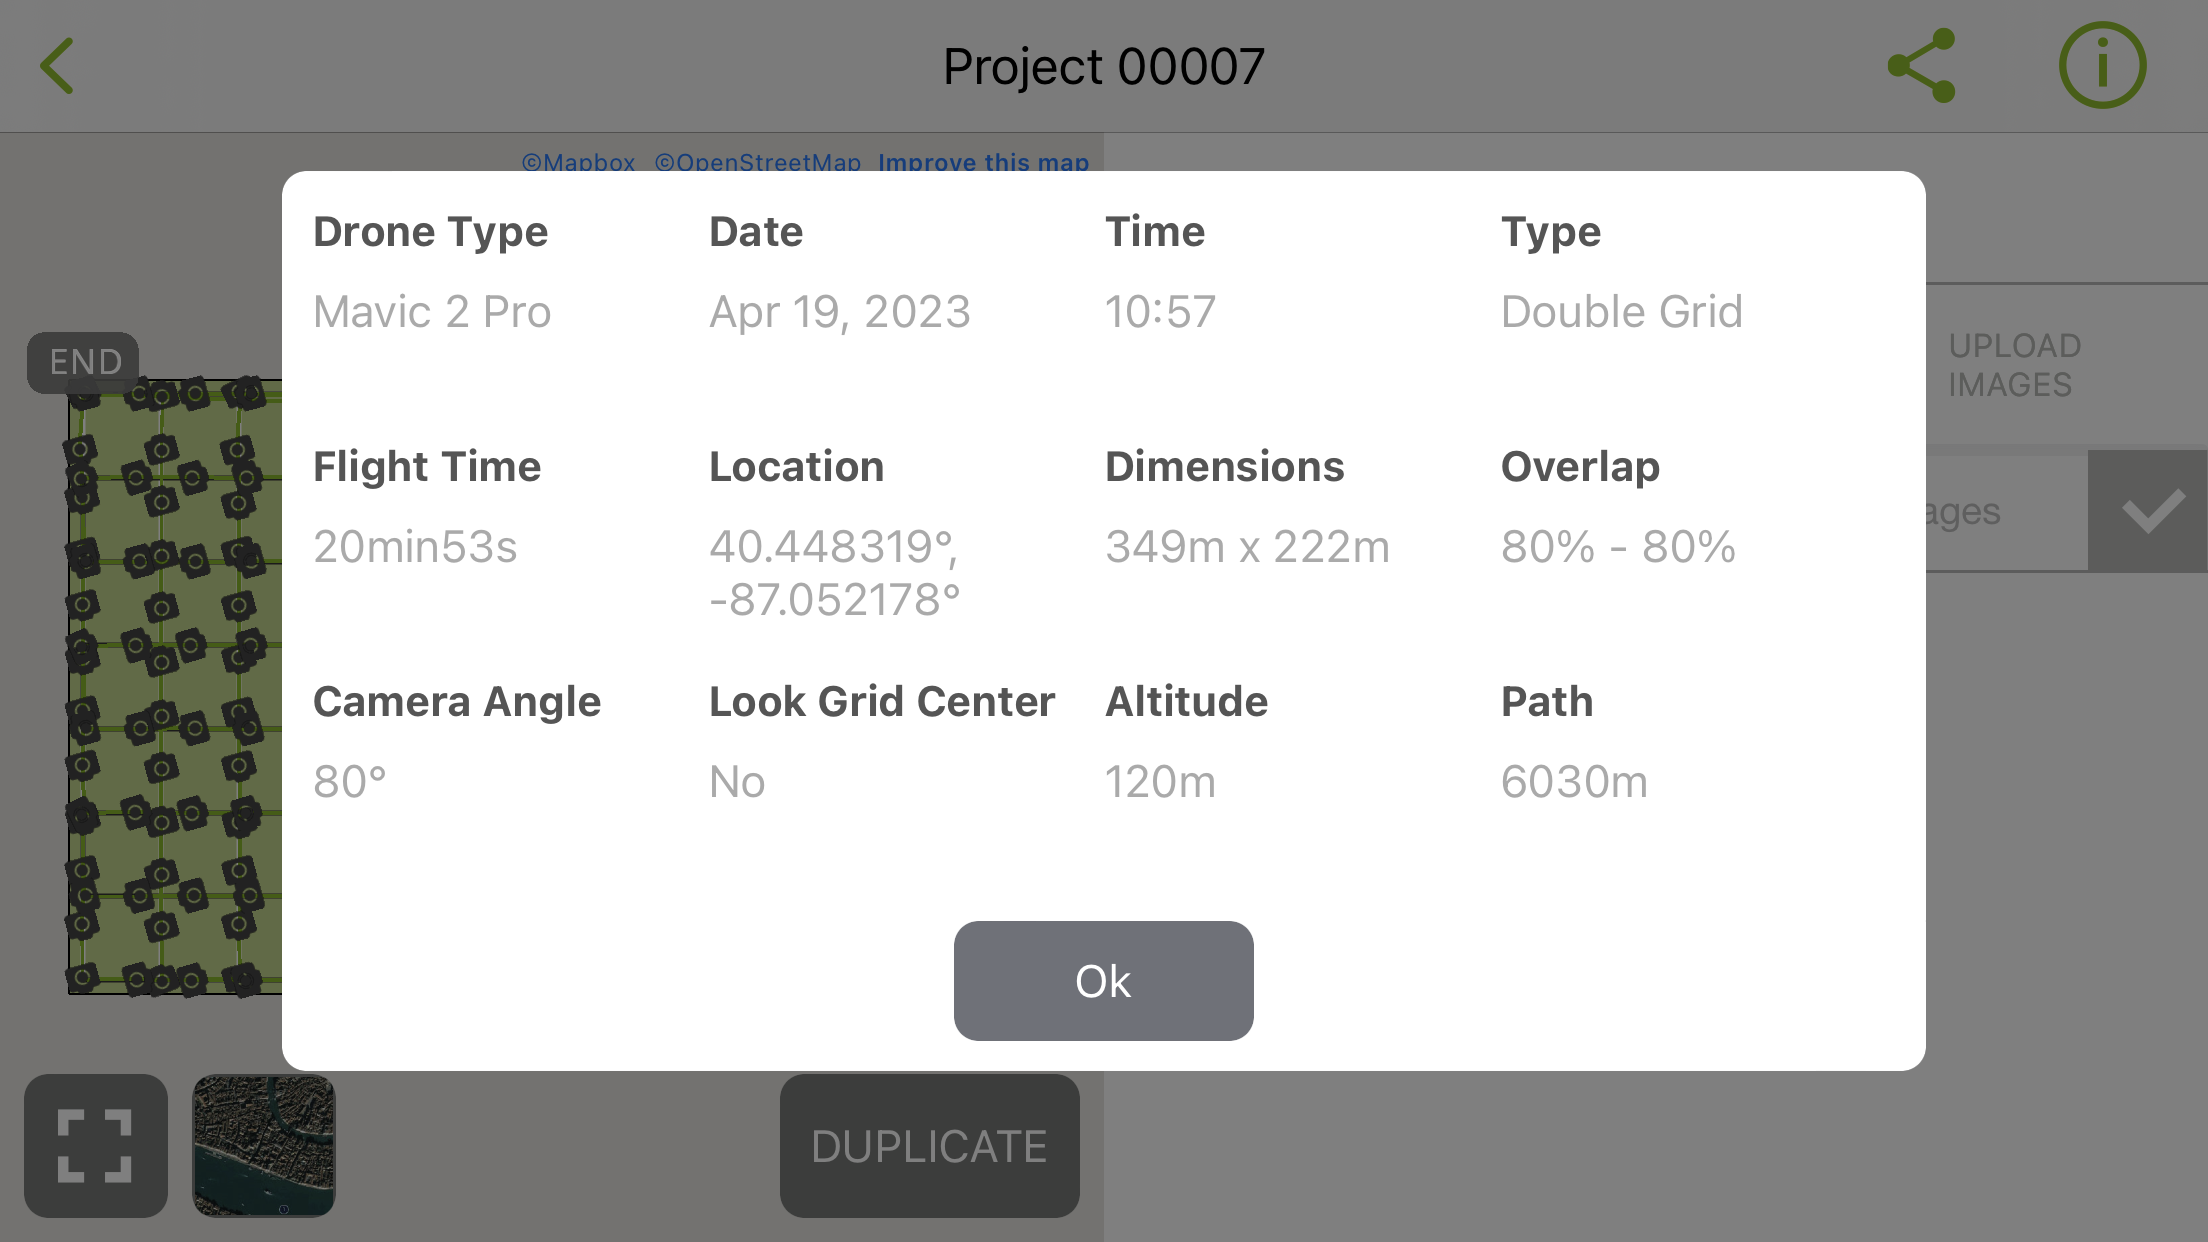
D. Flight Mission
E. GCP Data Upload
A laptop is connected to a hotspot of a cell phone and meanwhile creating local hotspot called “propeller” to let the GCP upload the data to the server.
II. Pix4D Process
A. Import Data
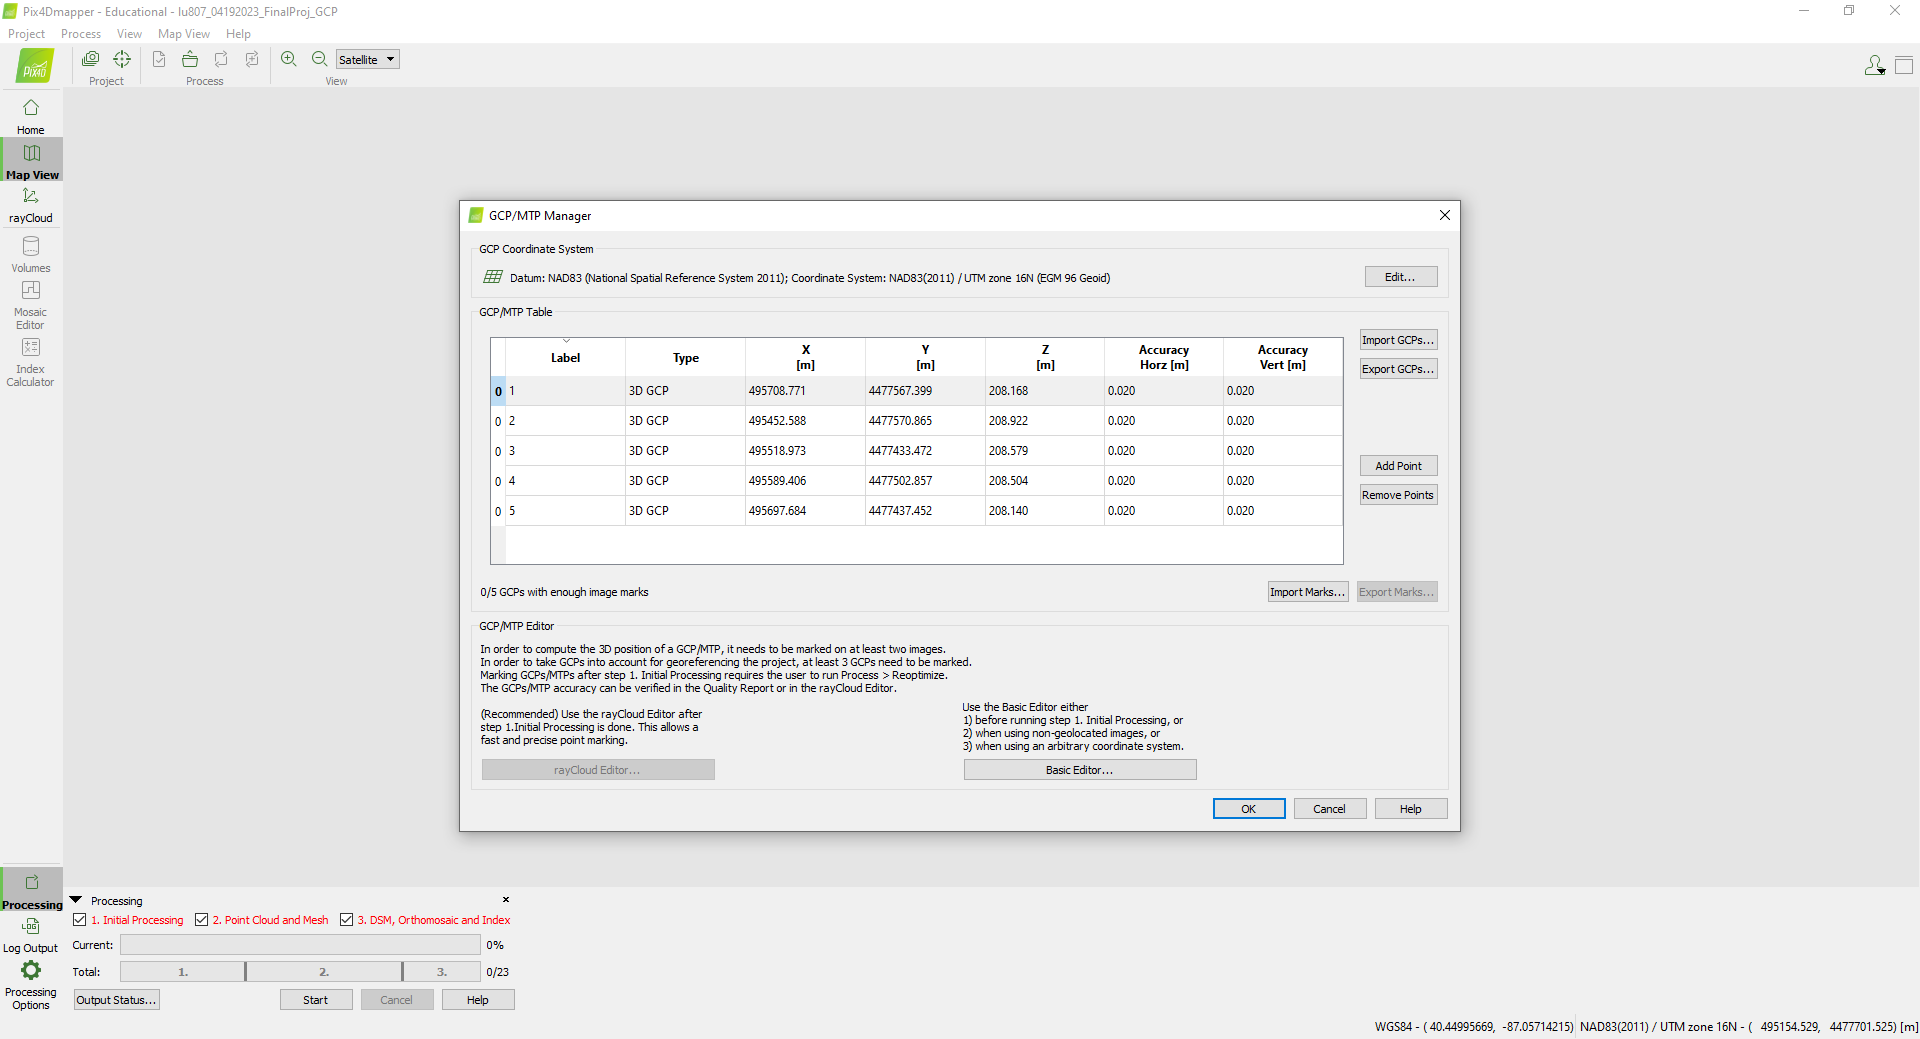
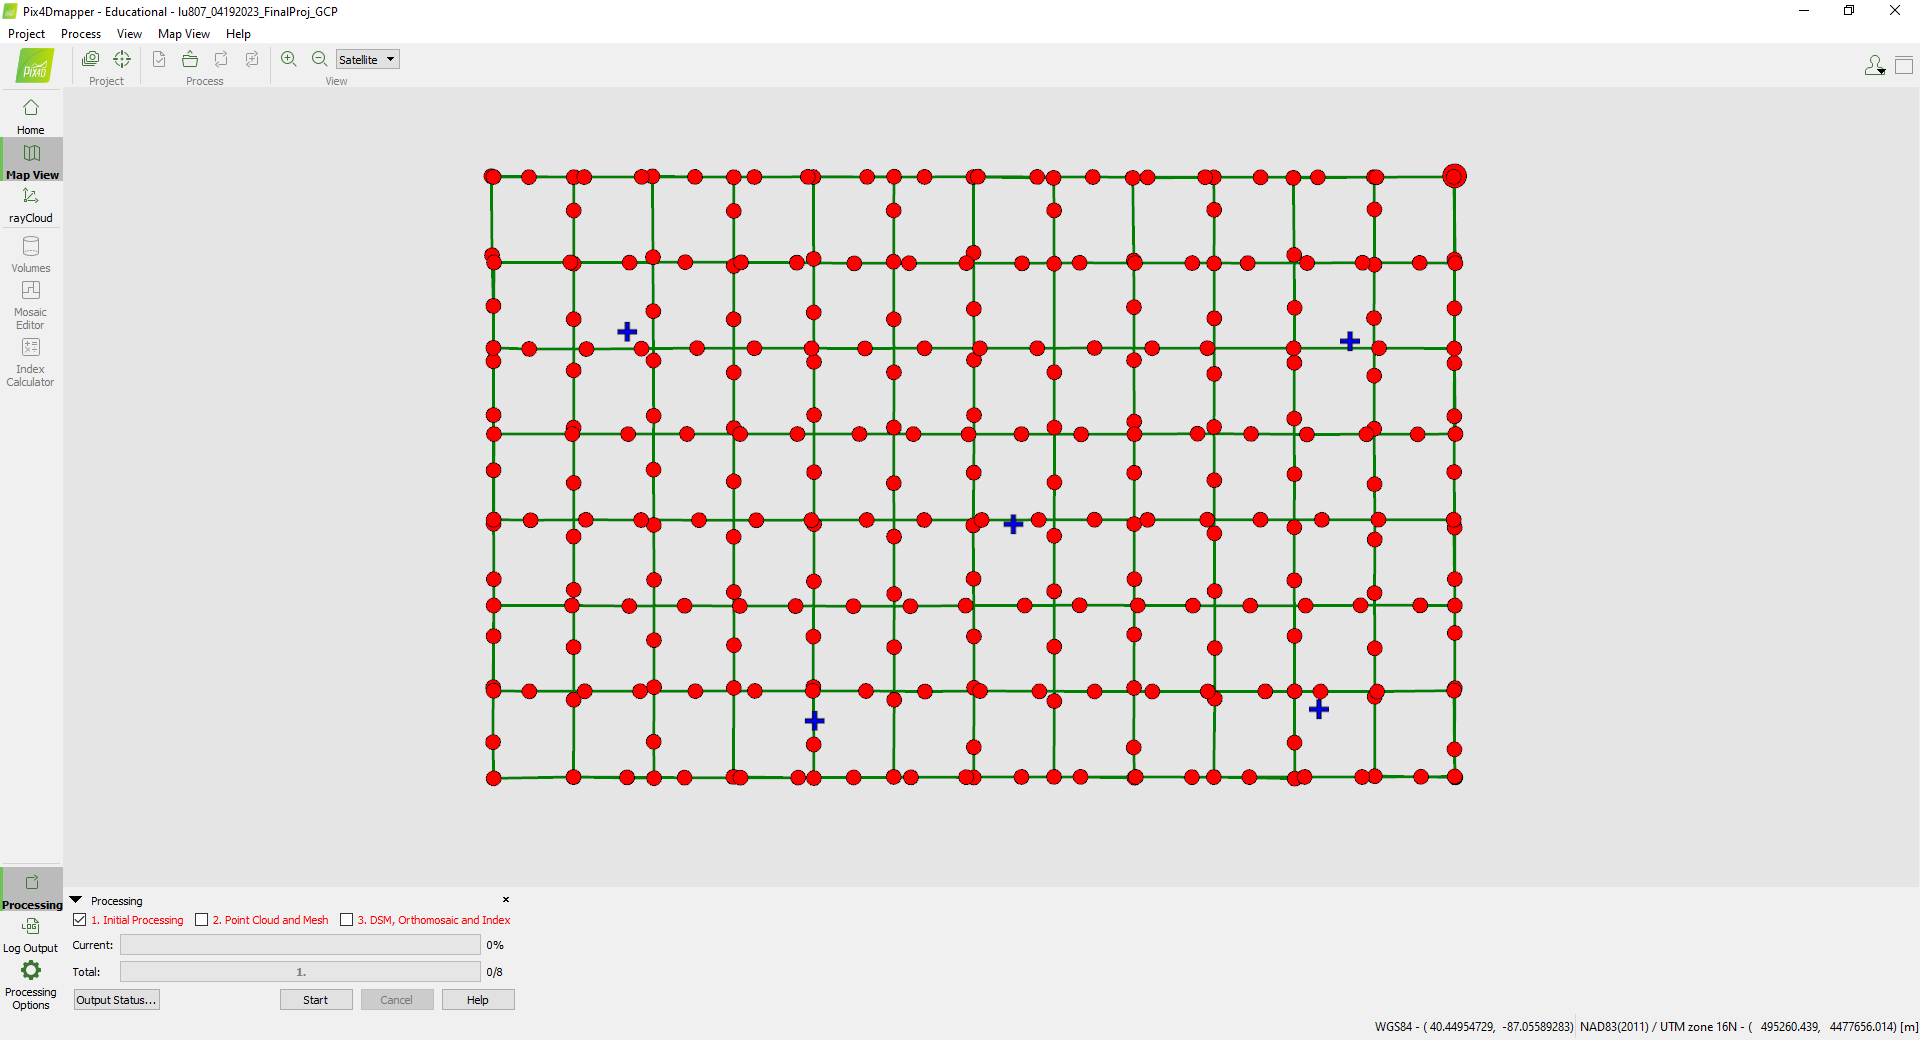
Referring to previous labs (eg. week 9 lab 8), 297 pictures were added. Also, GCP points (Northing, Easting, and Orthometric height ) were extracted from the CSV file which was downloaded from the Aeropoint server.
B. Initial Processing
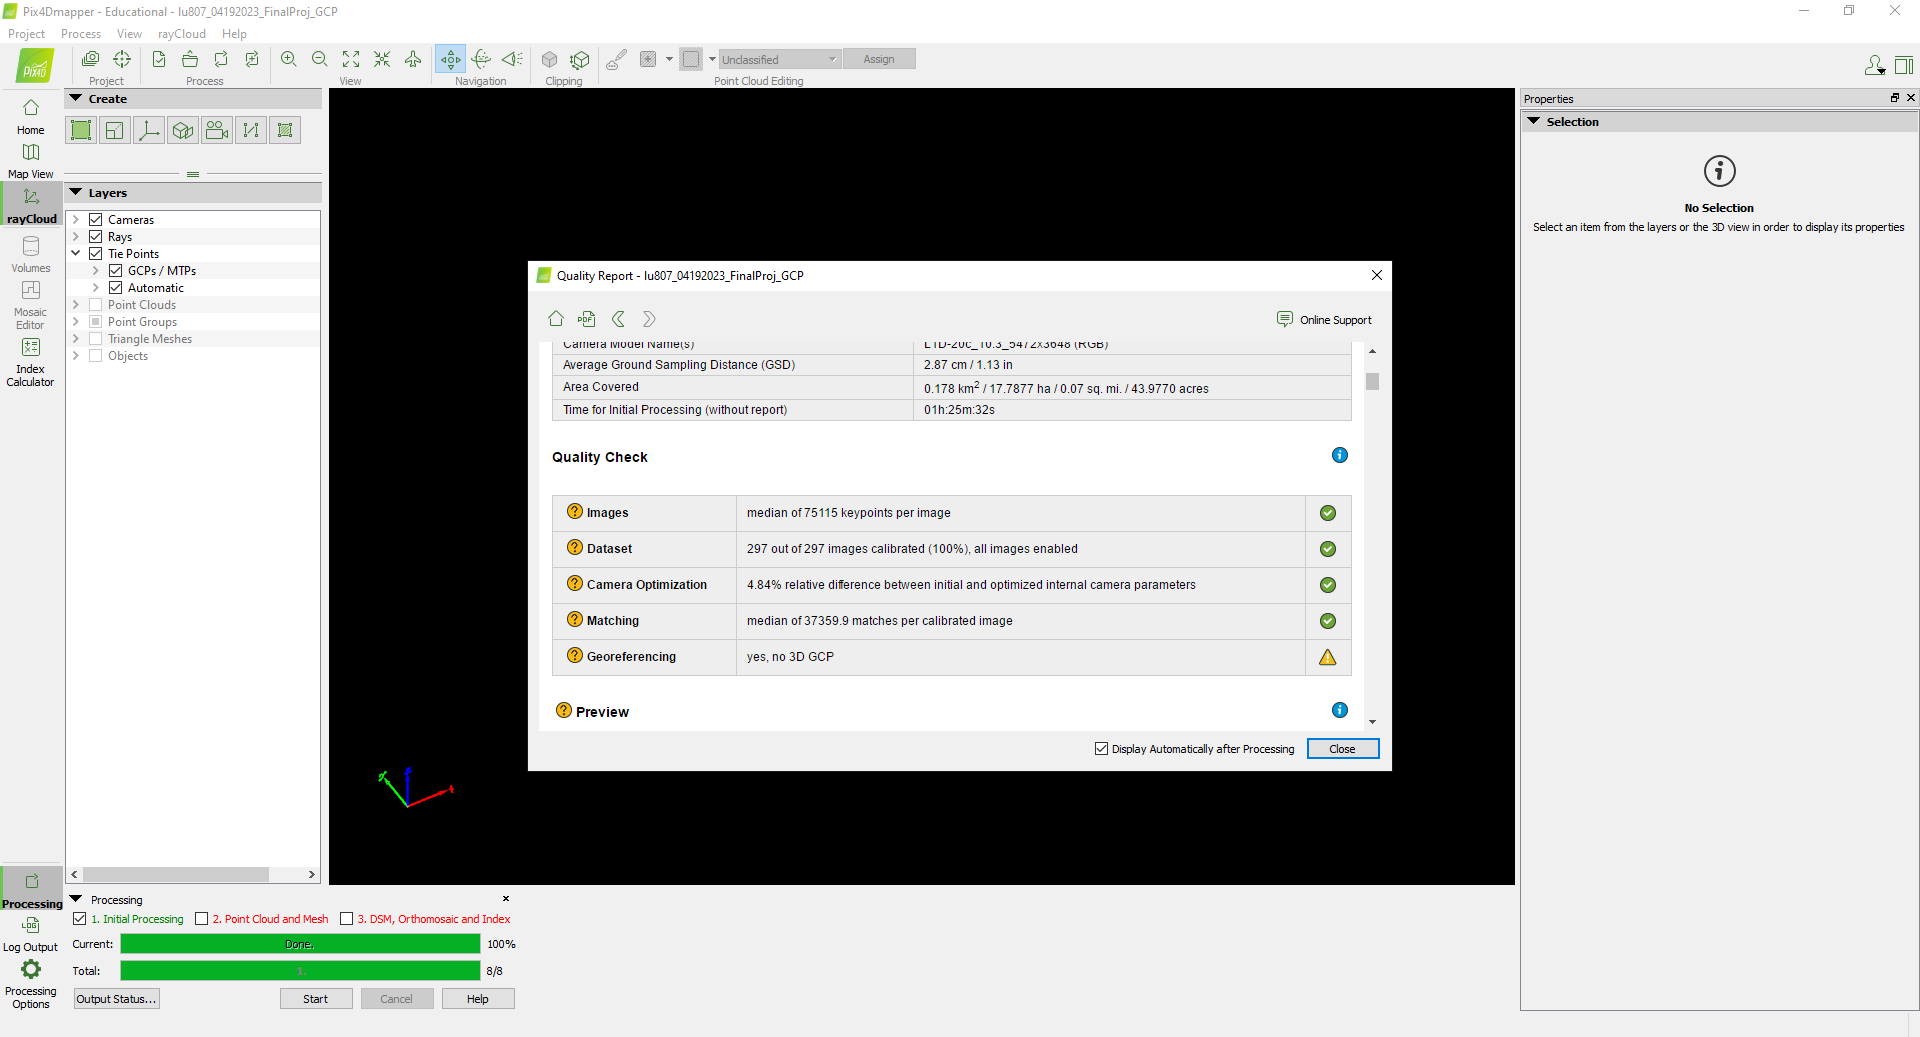
Uncheck 2 and 3 → Start. After Initial processing is finished, check if the image quality is good or not.
C. GCP Calibration
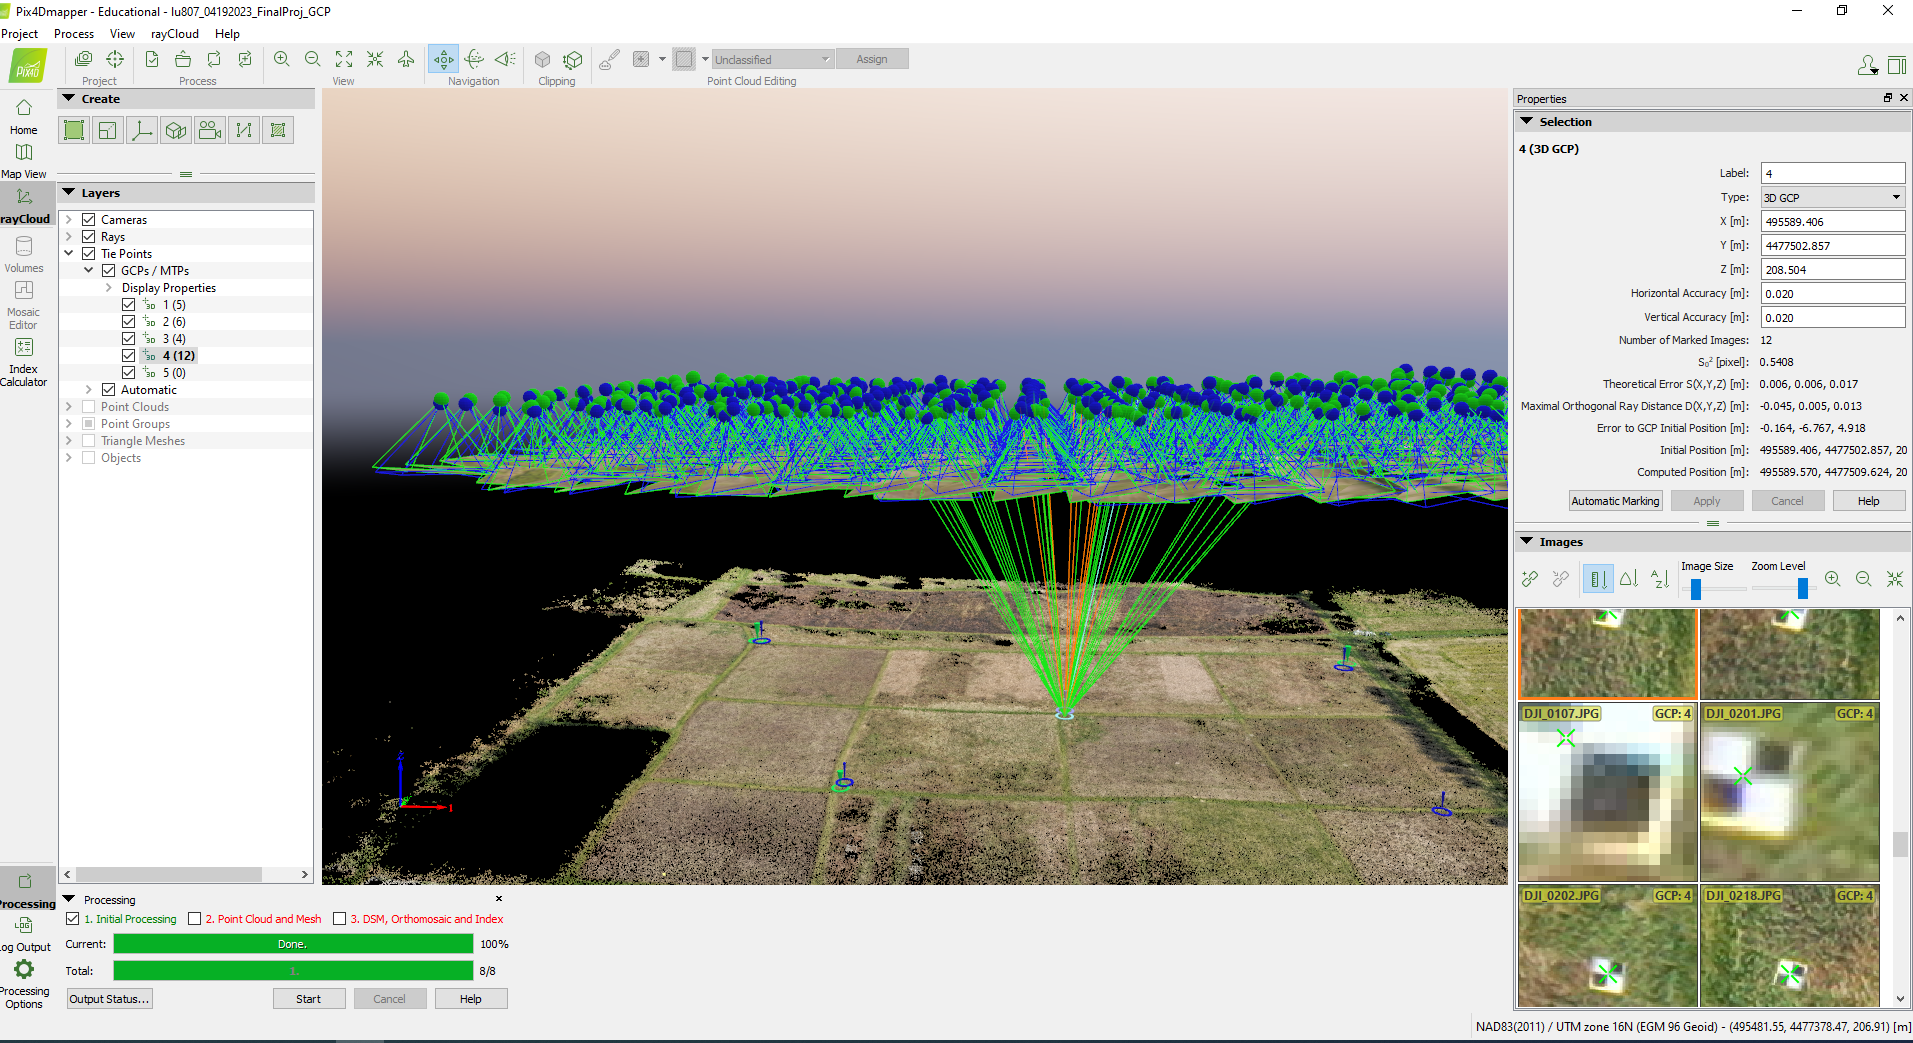
Click each GCP and calibrate them on the right plane.
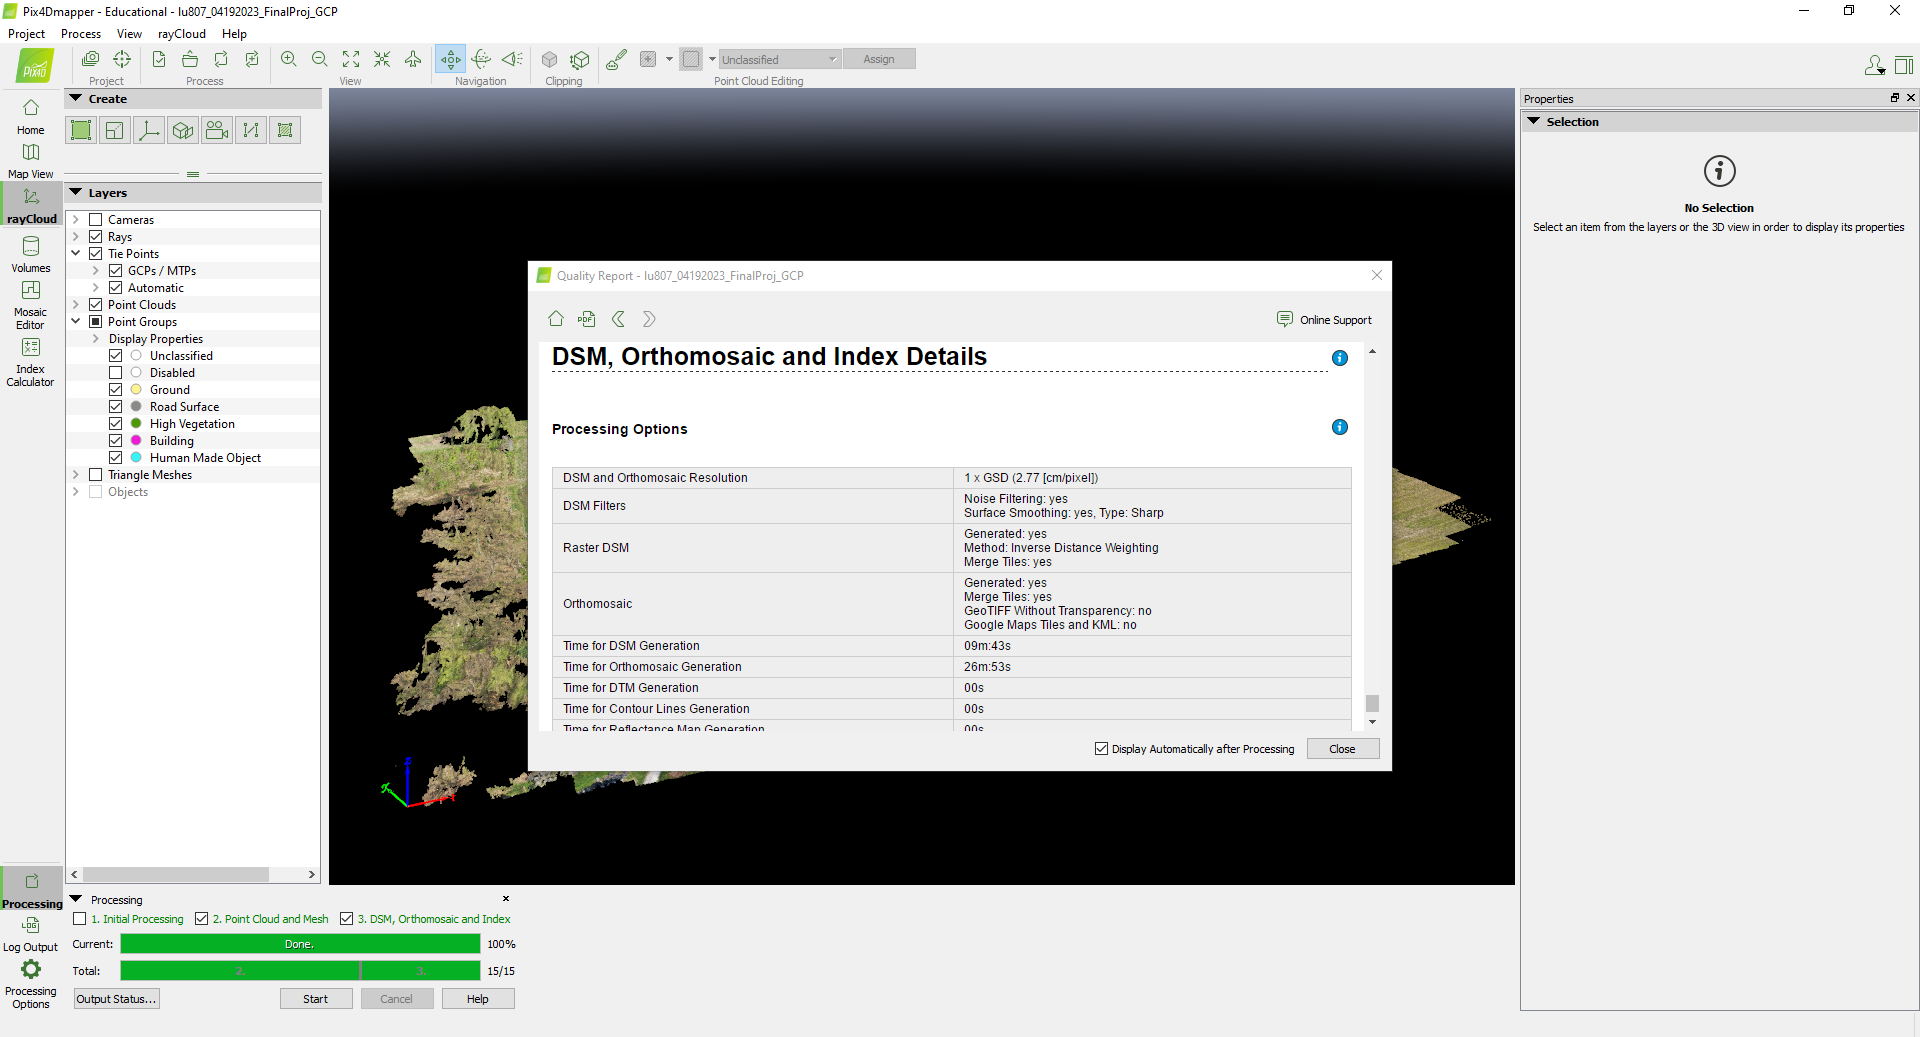
D. DSM and Orthomosaic
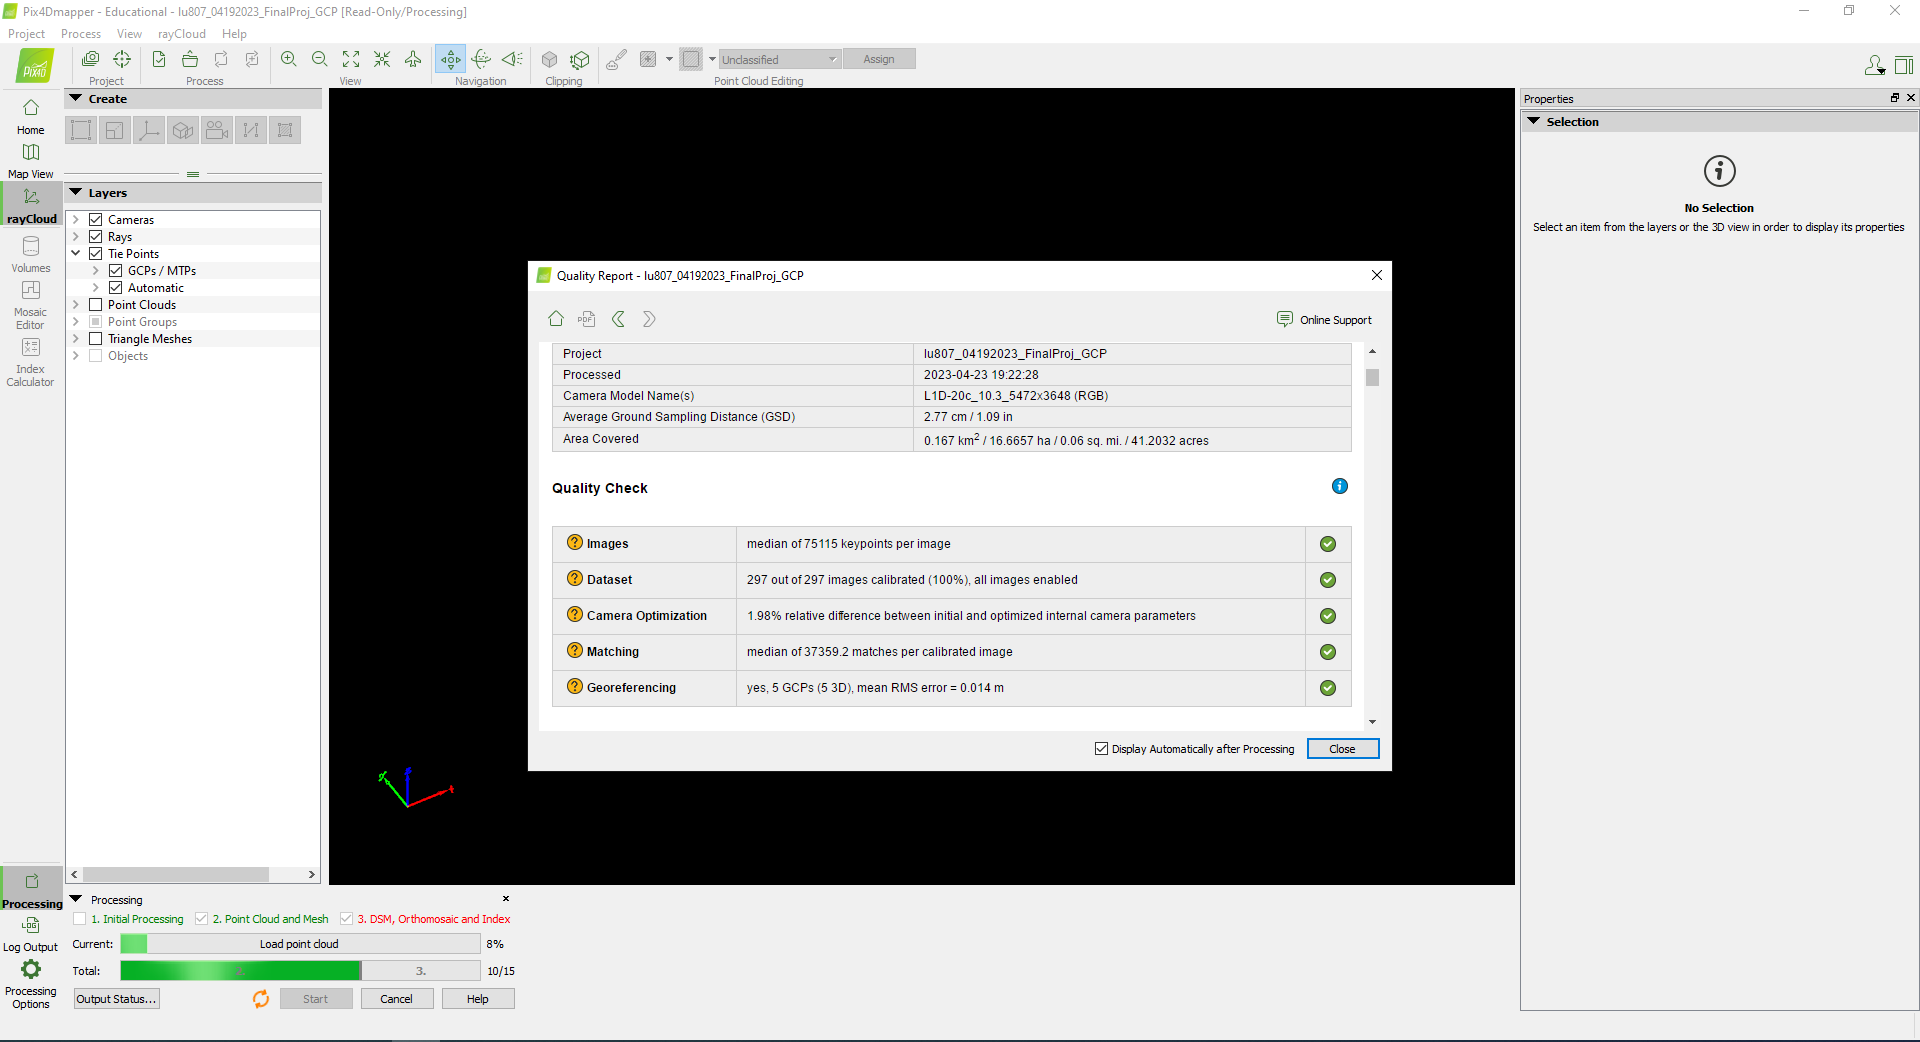
Reoptimize, and run 2 and 3.
III. ArcGIS Pro Analysis
A. General Overview
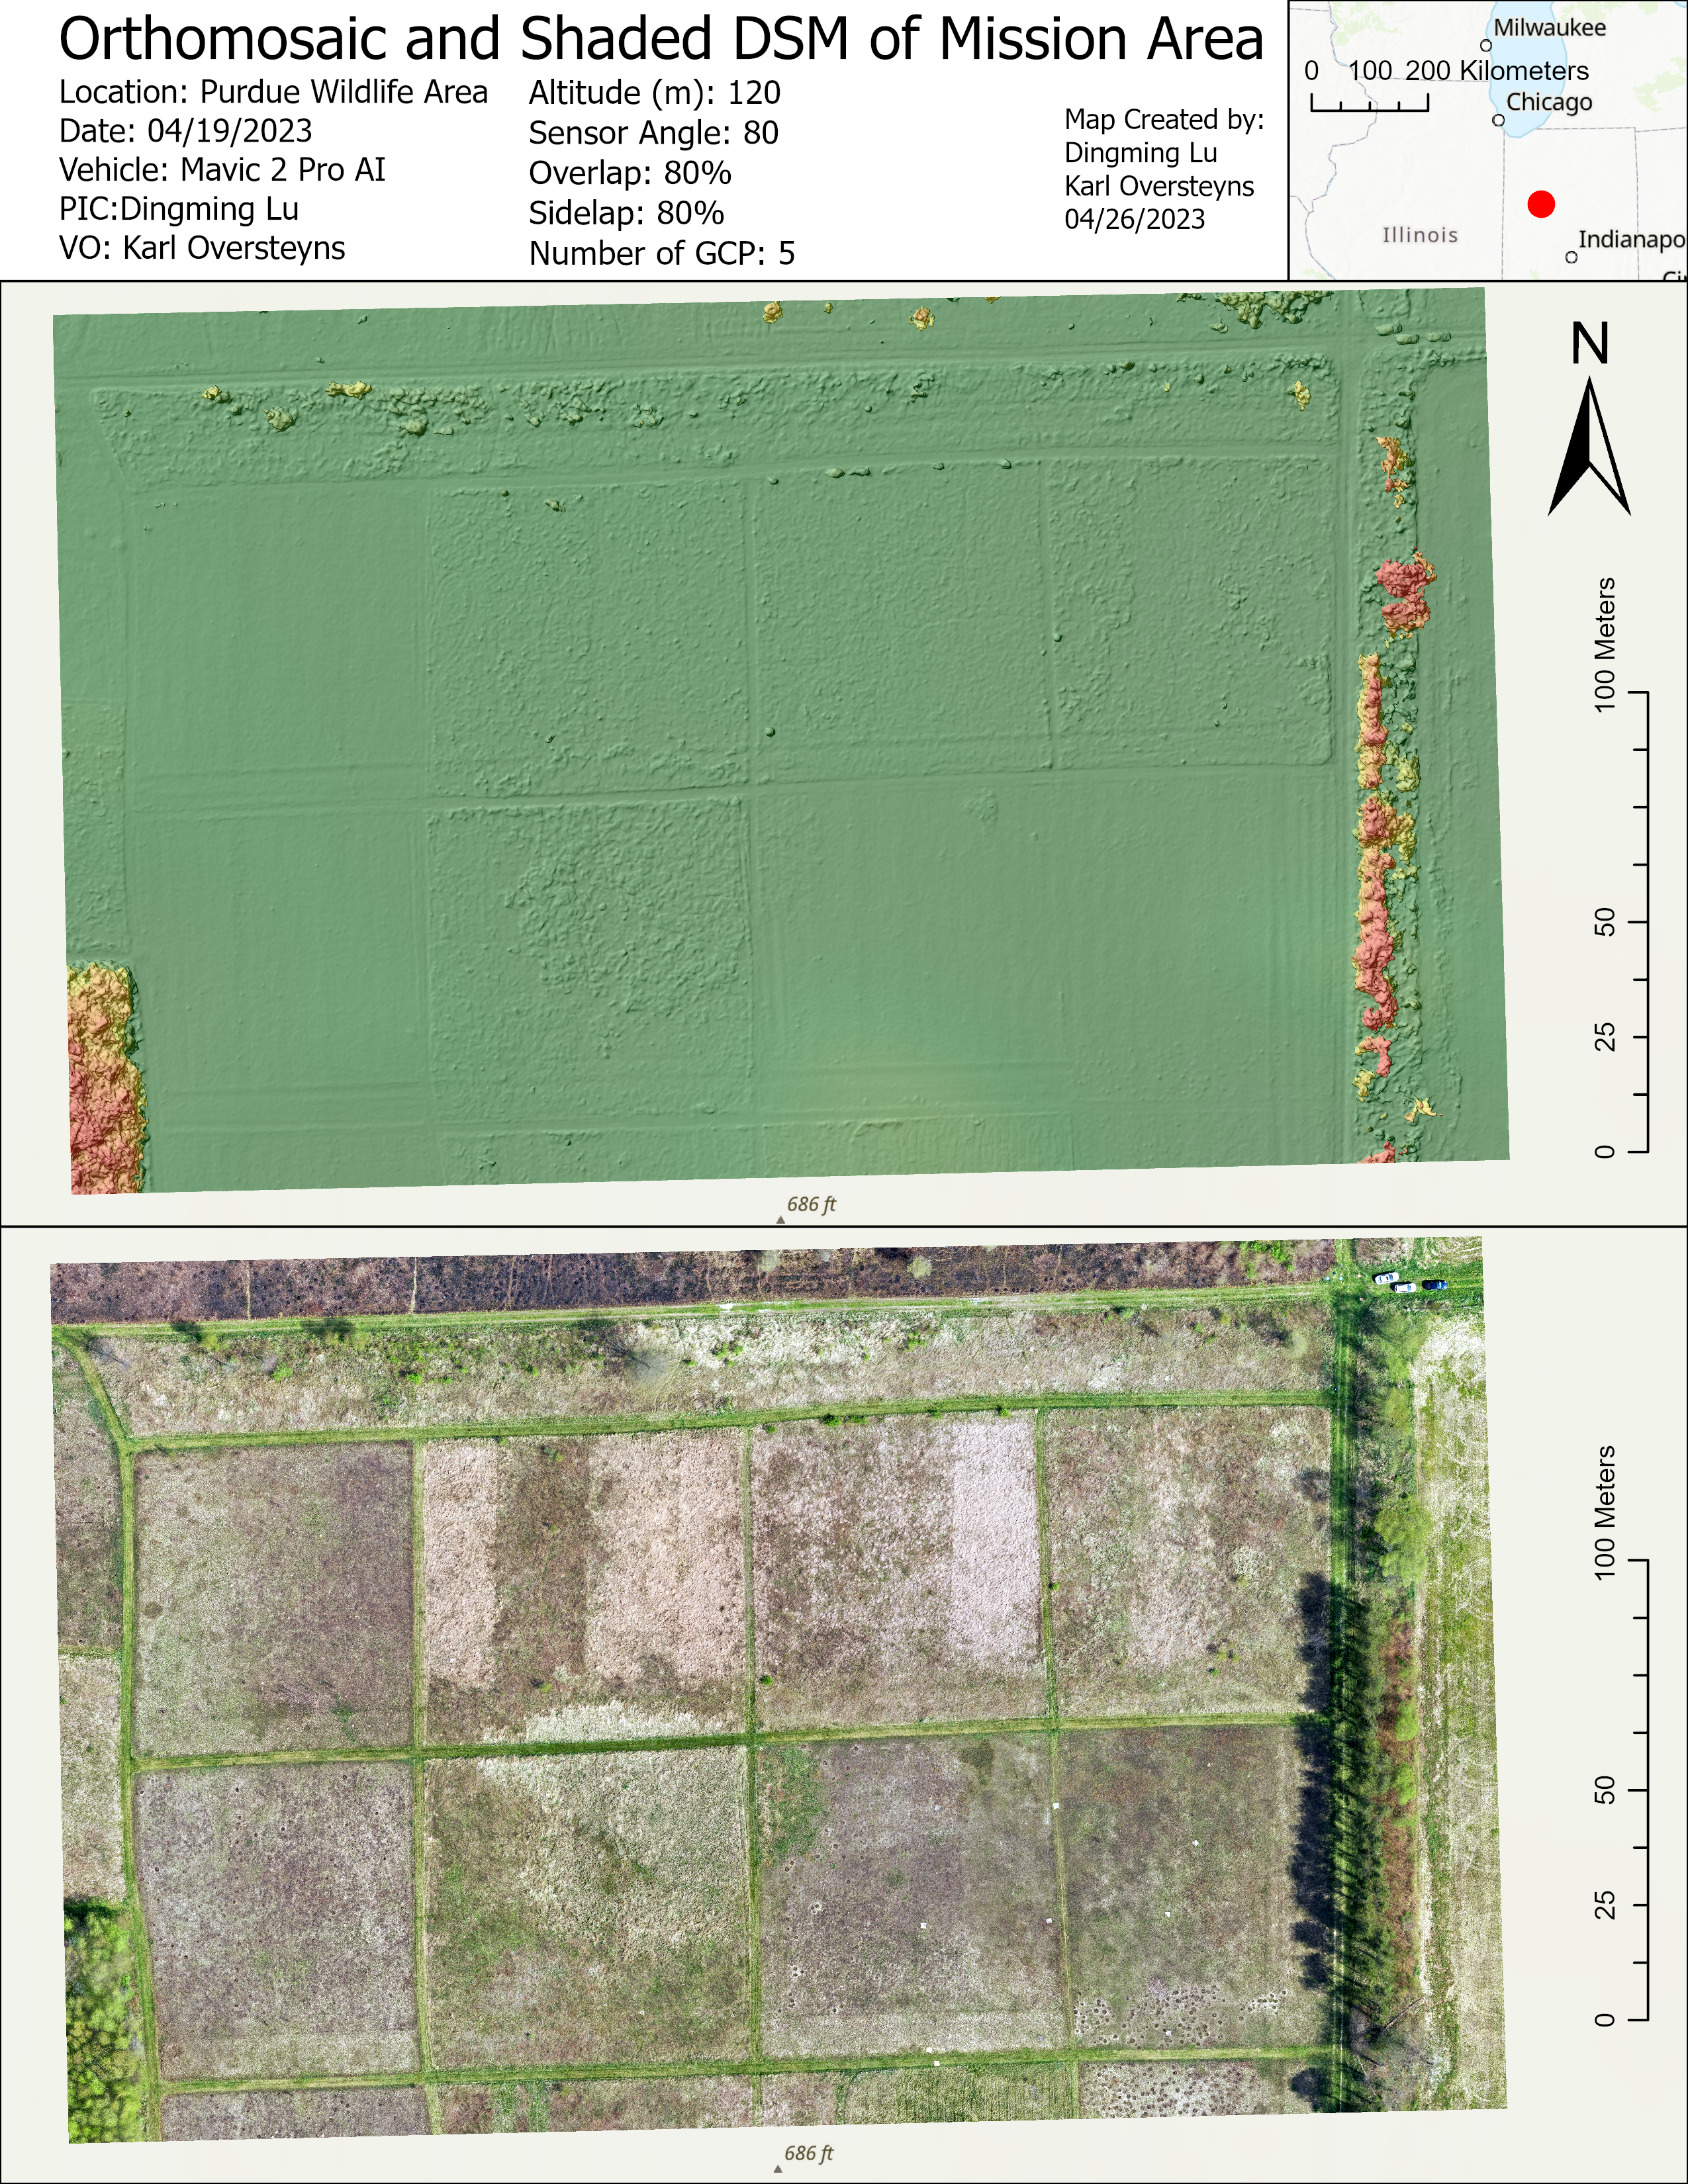
The folder with Orthomosaic and DSM data were connected to the ArcGIS Pro project folder.
A polygon was created to extract the analysis area. Extract by mask and hillshade tools were used.
B. Classification
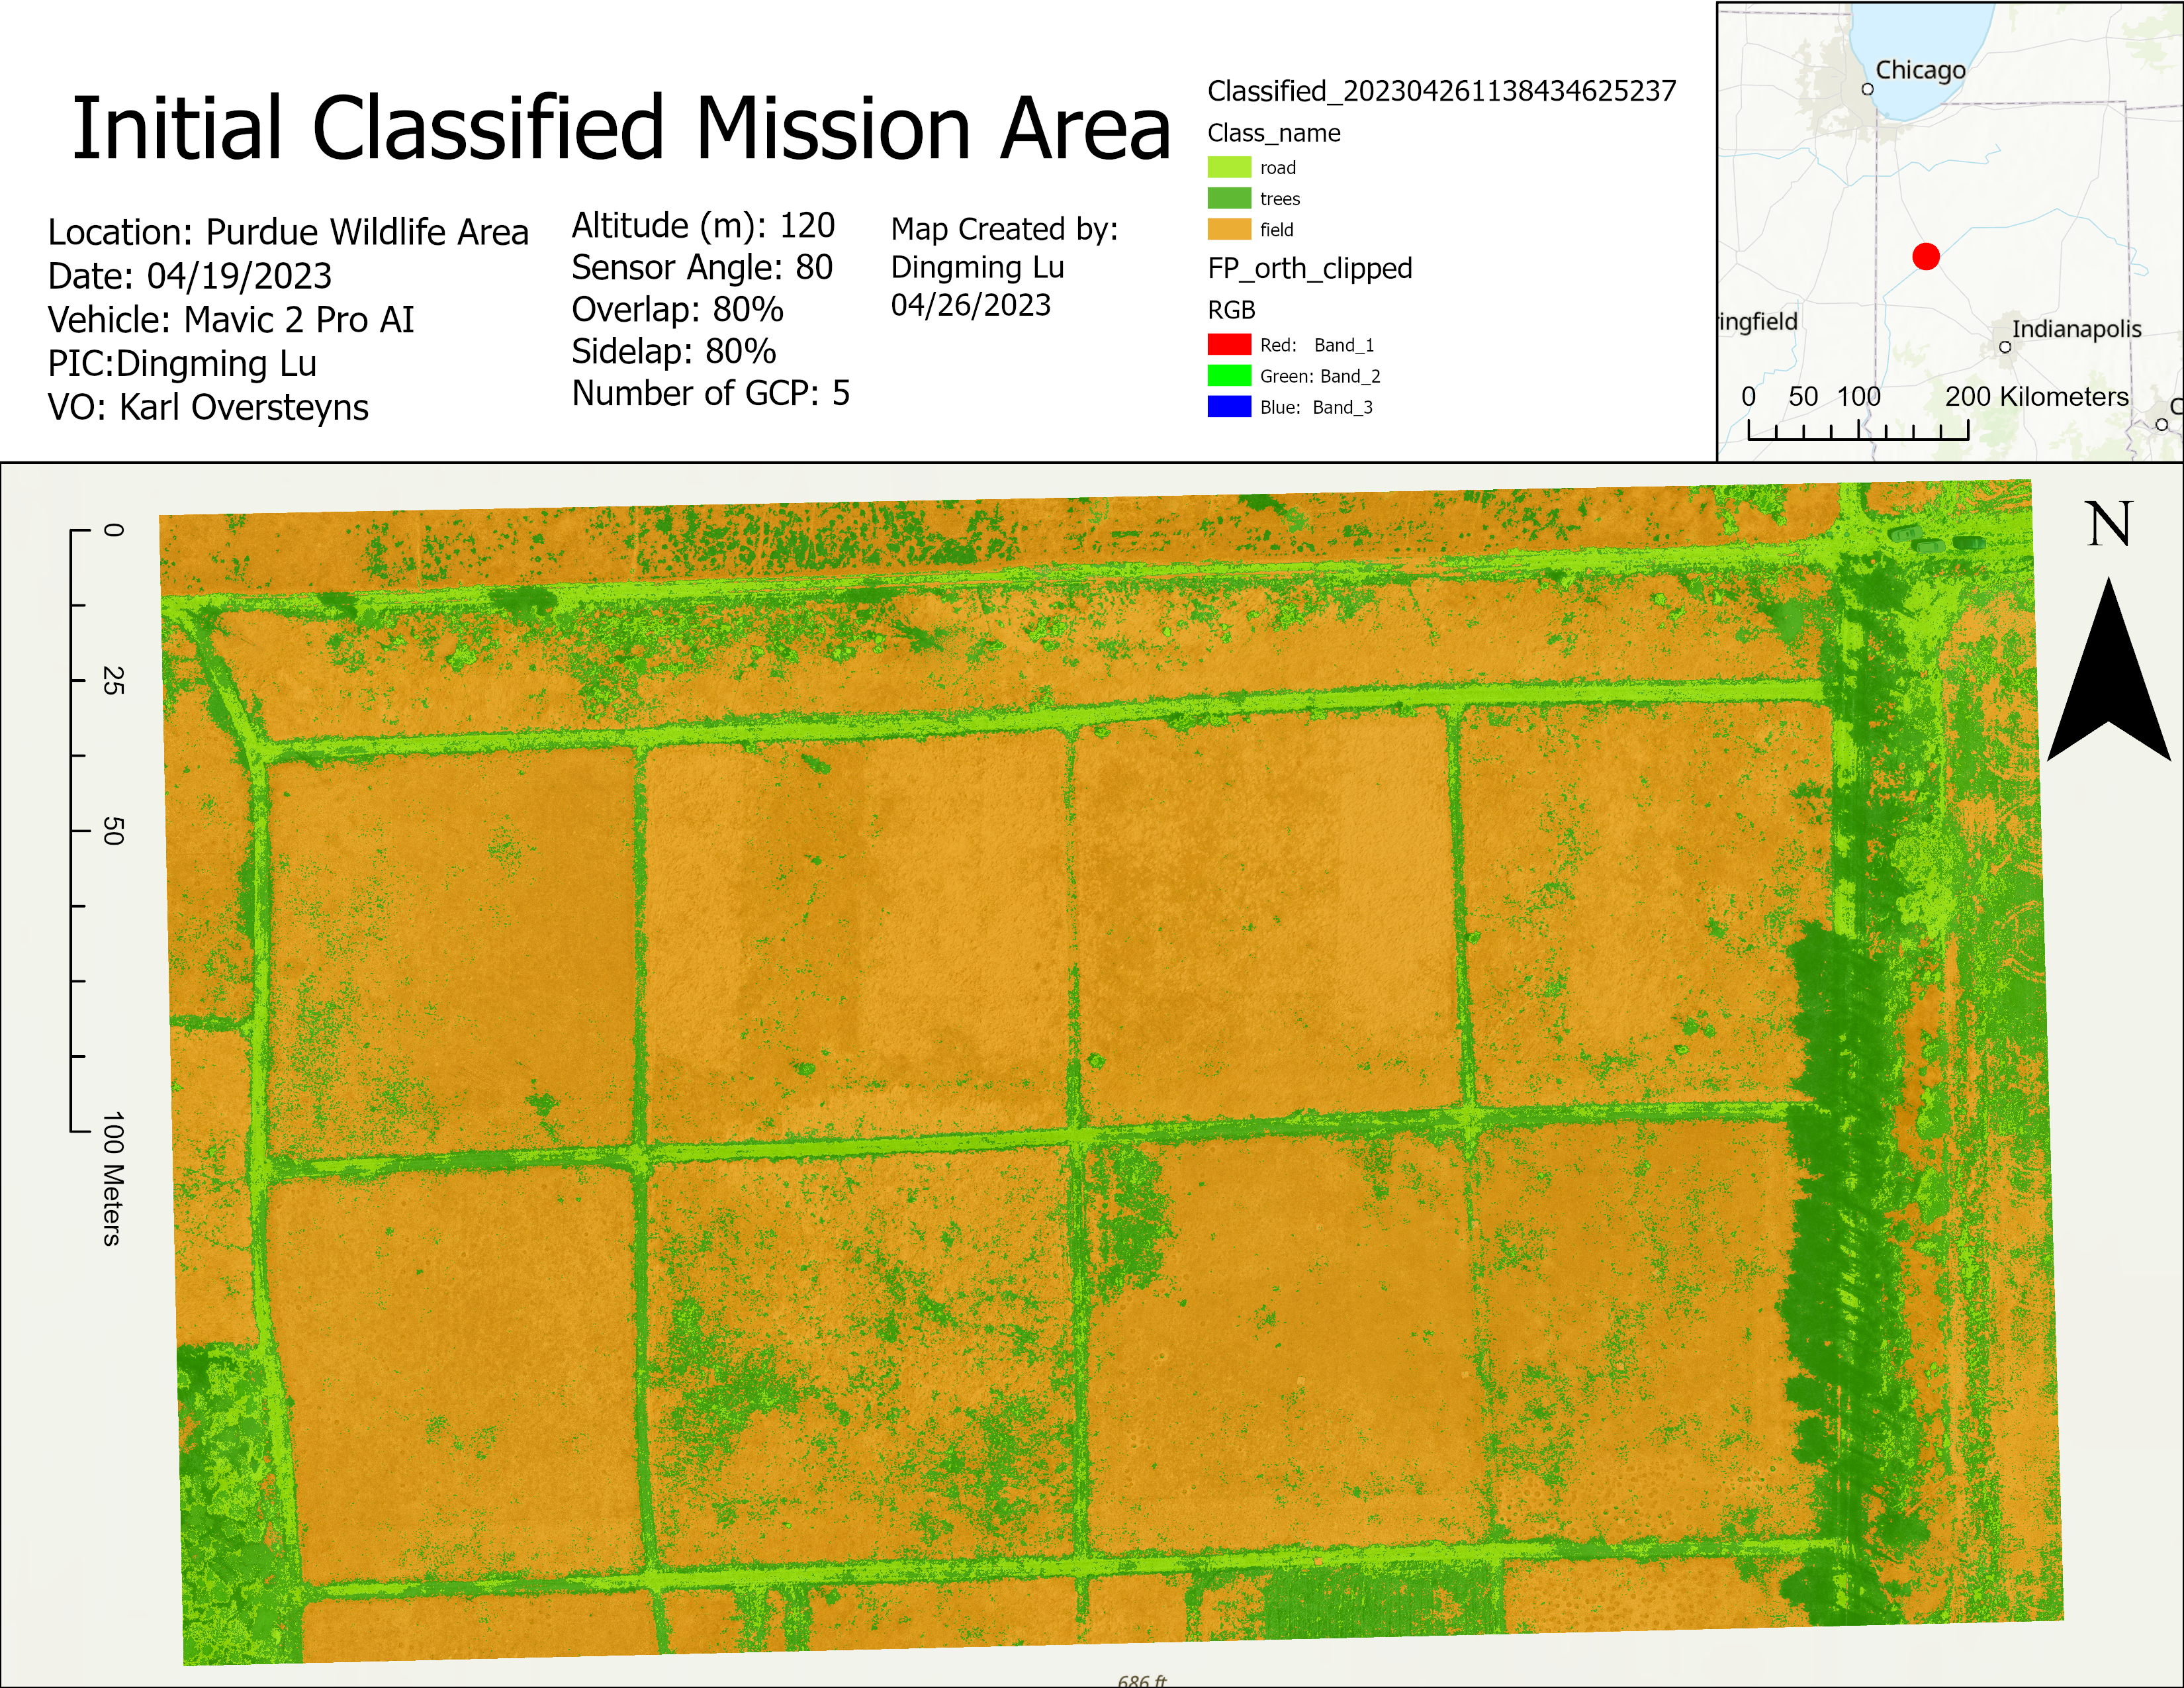
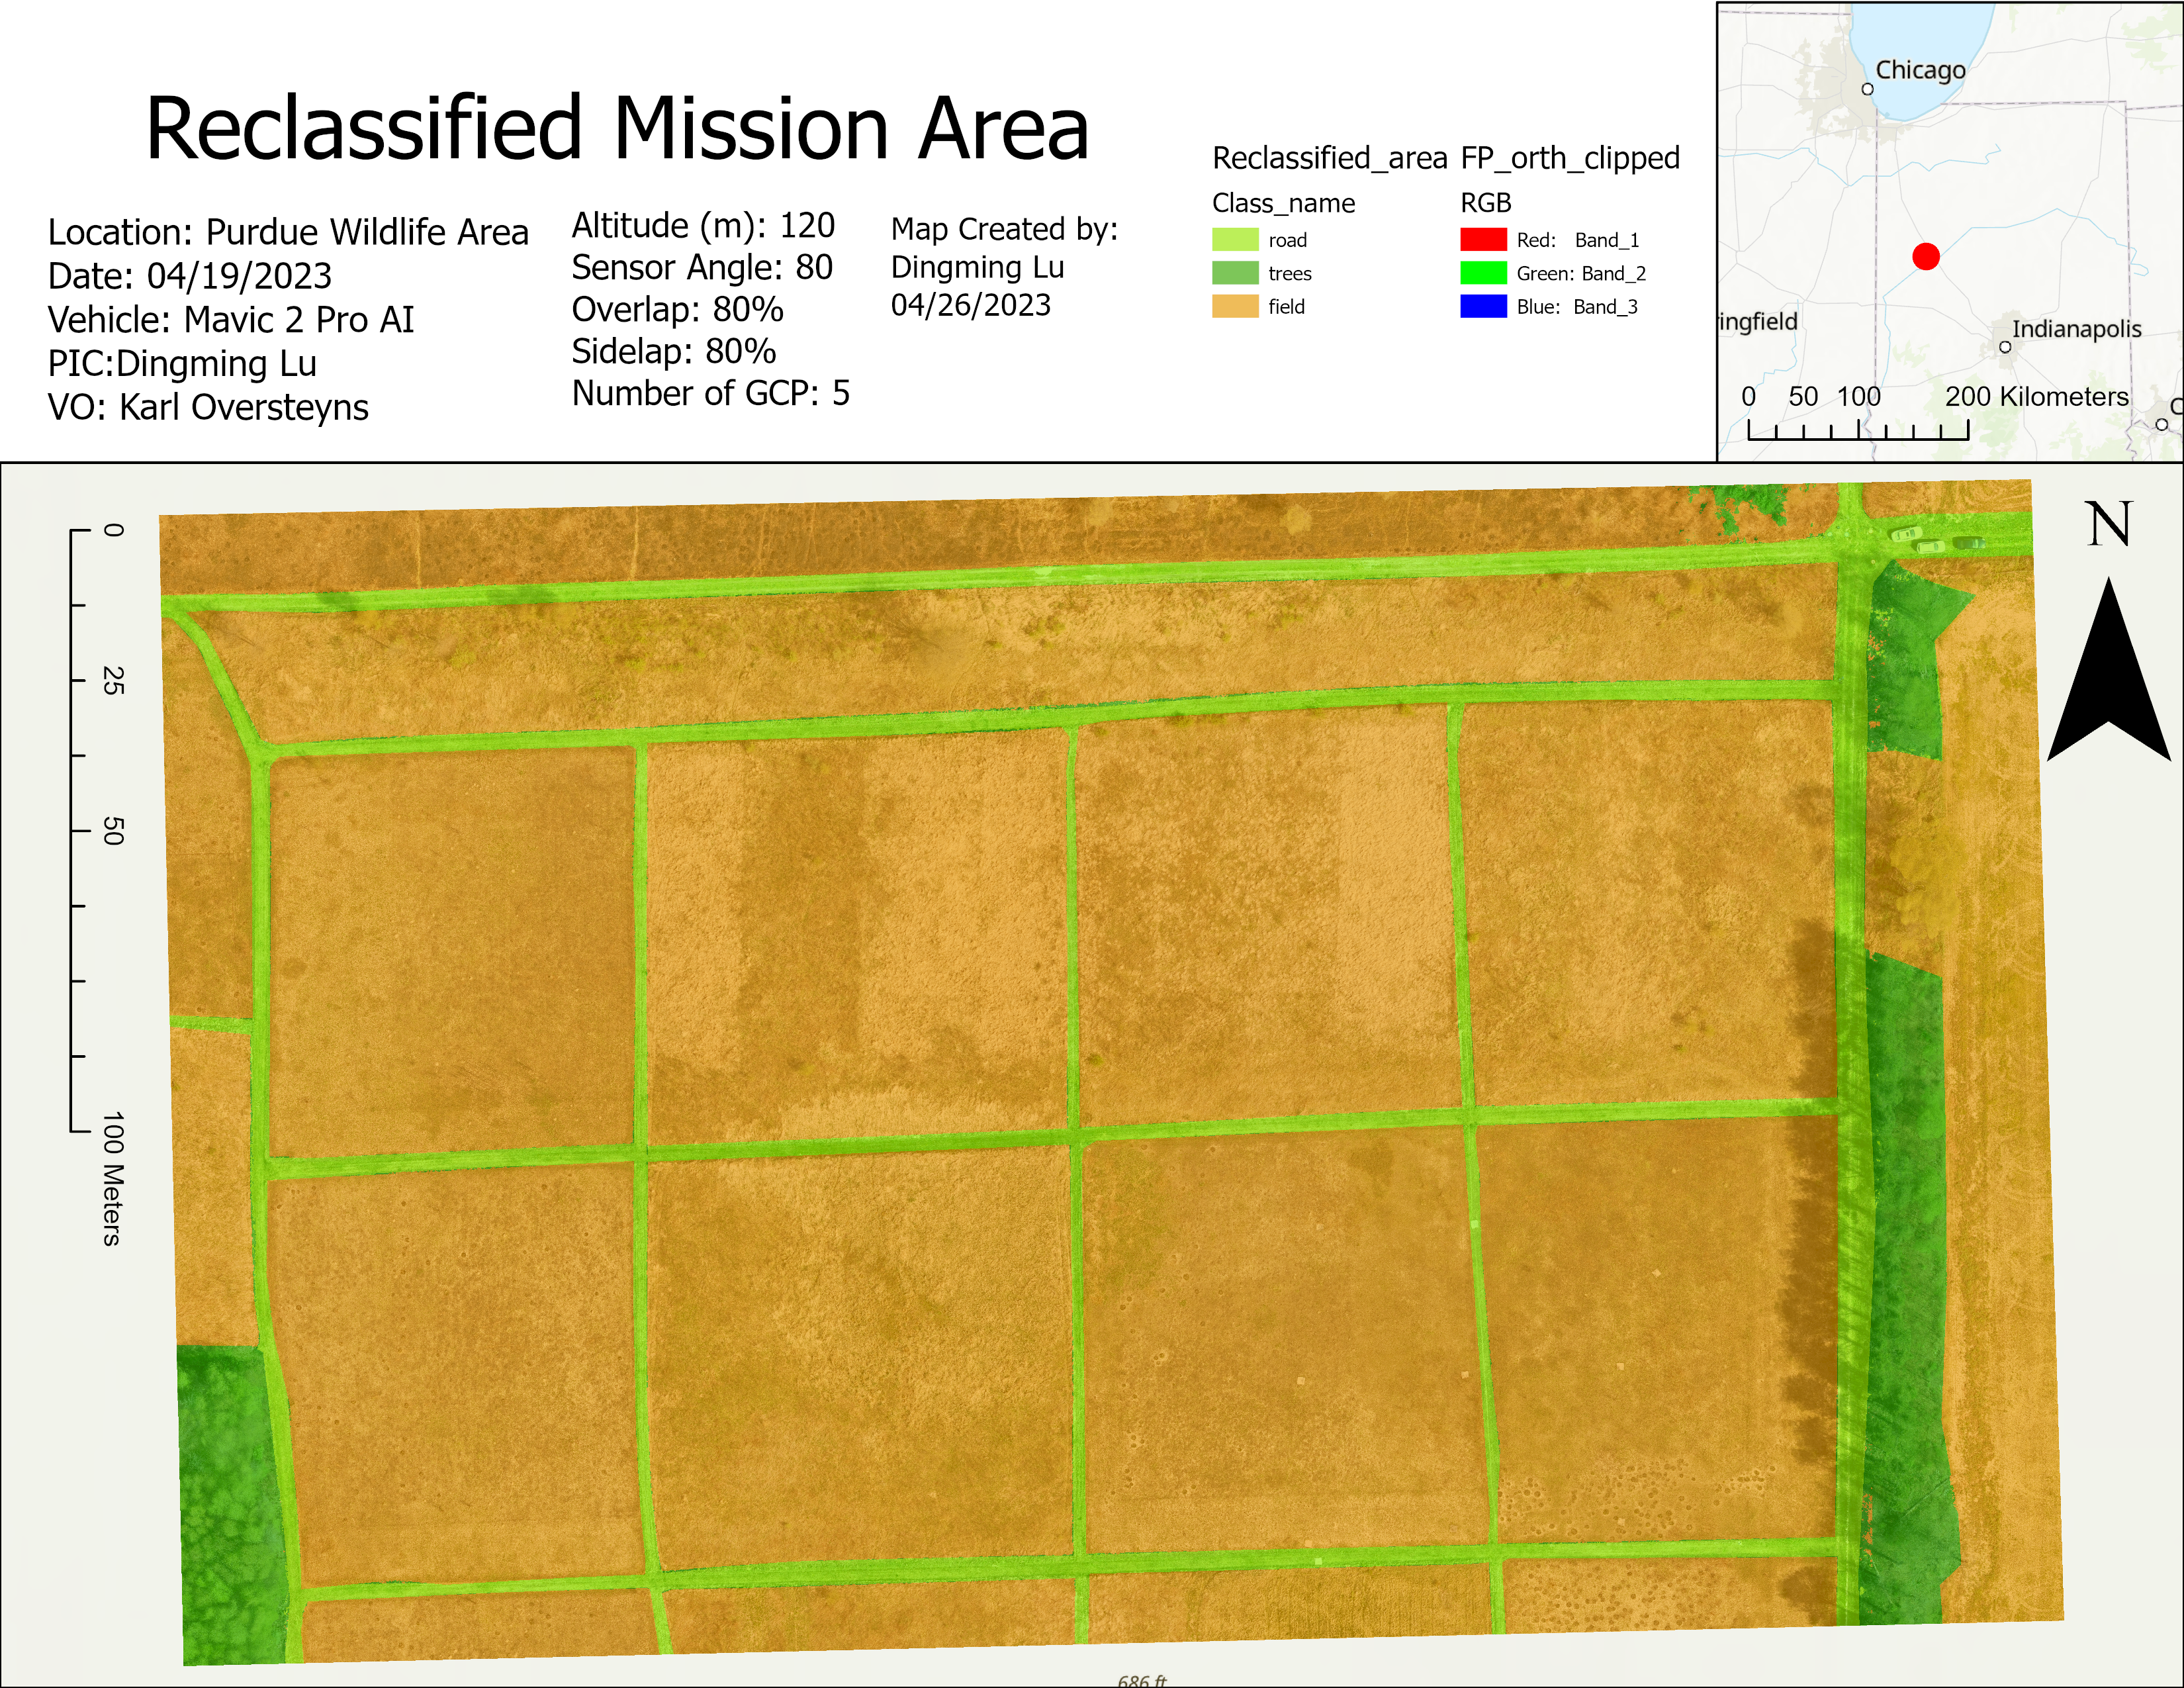
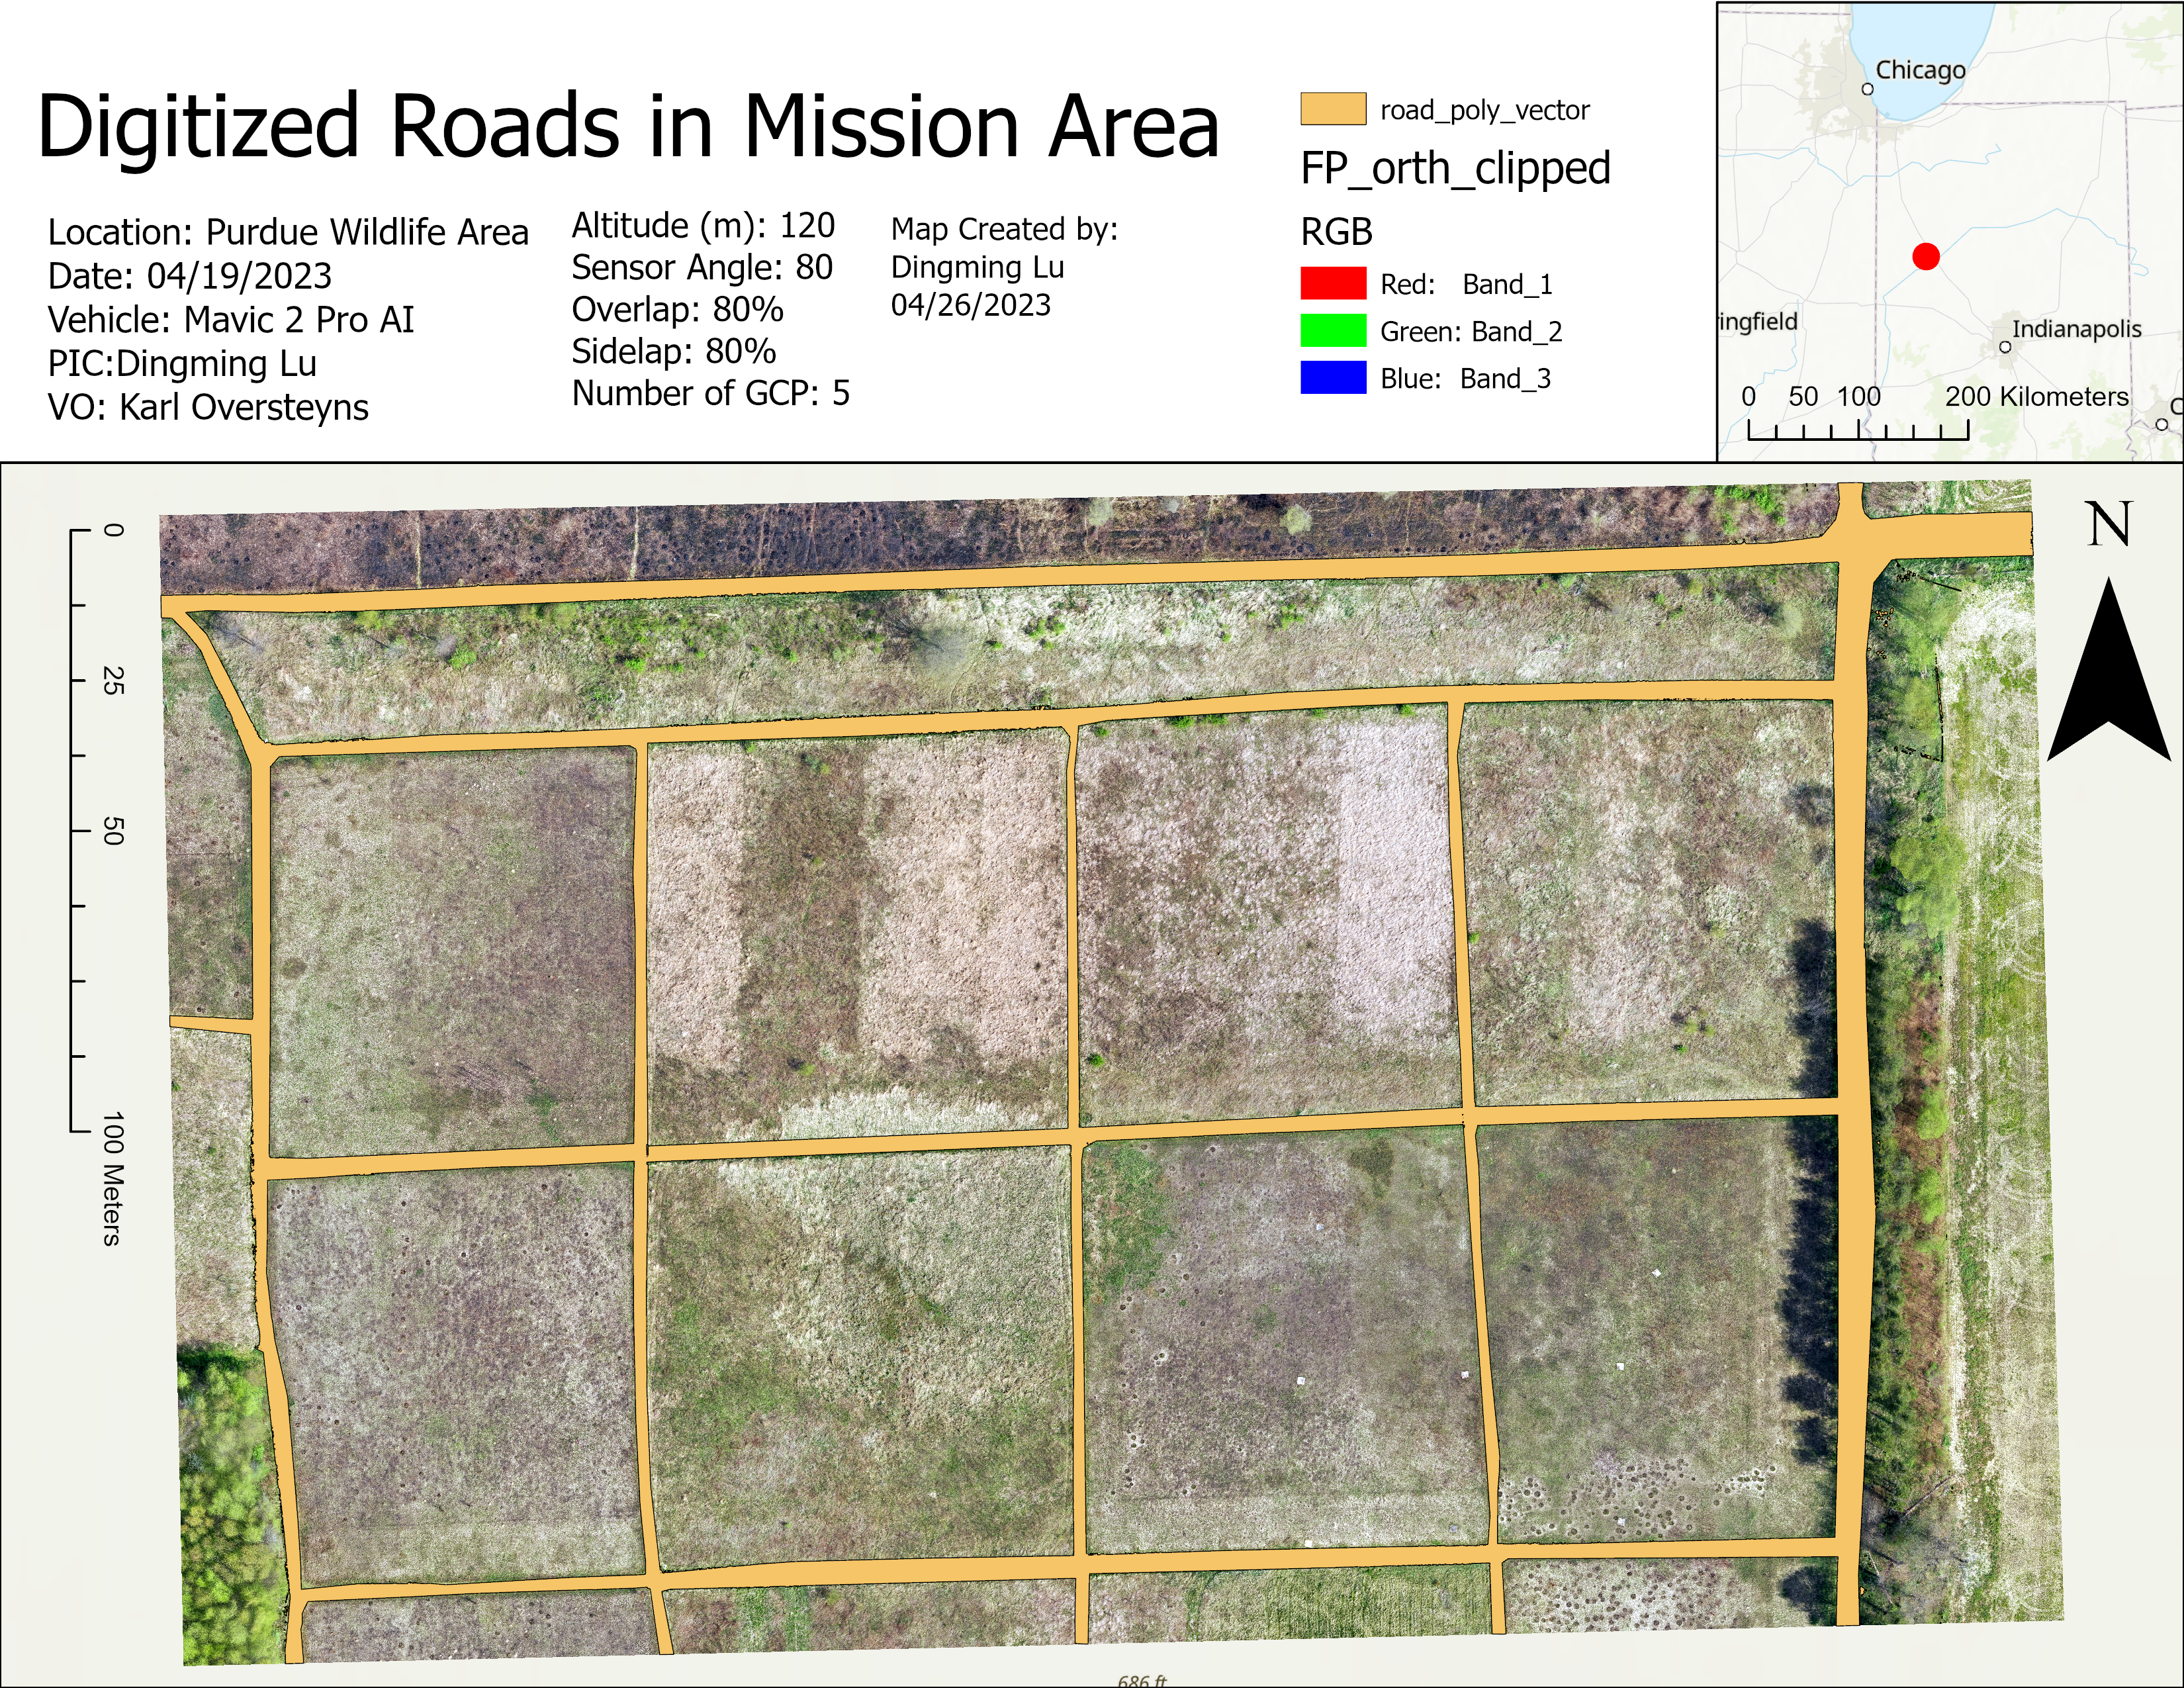
C. Analysis
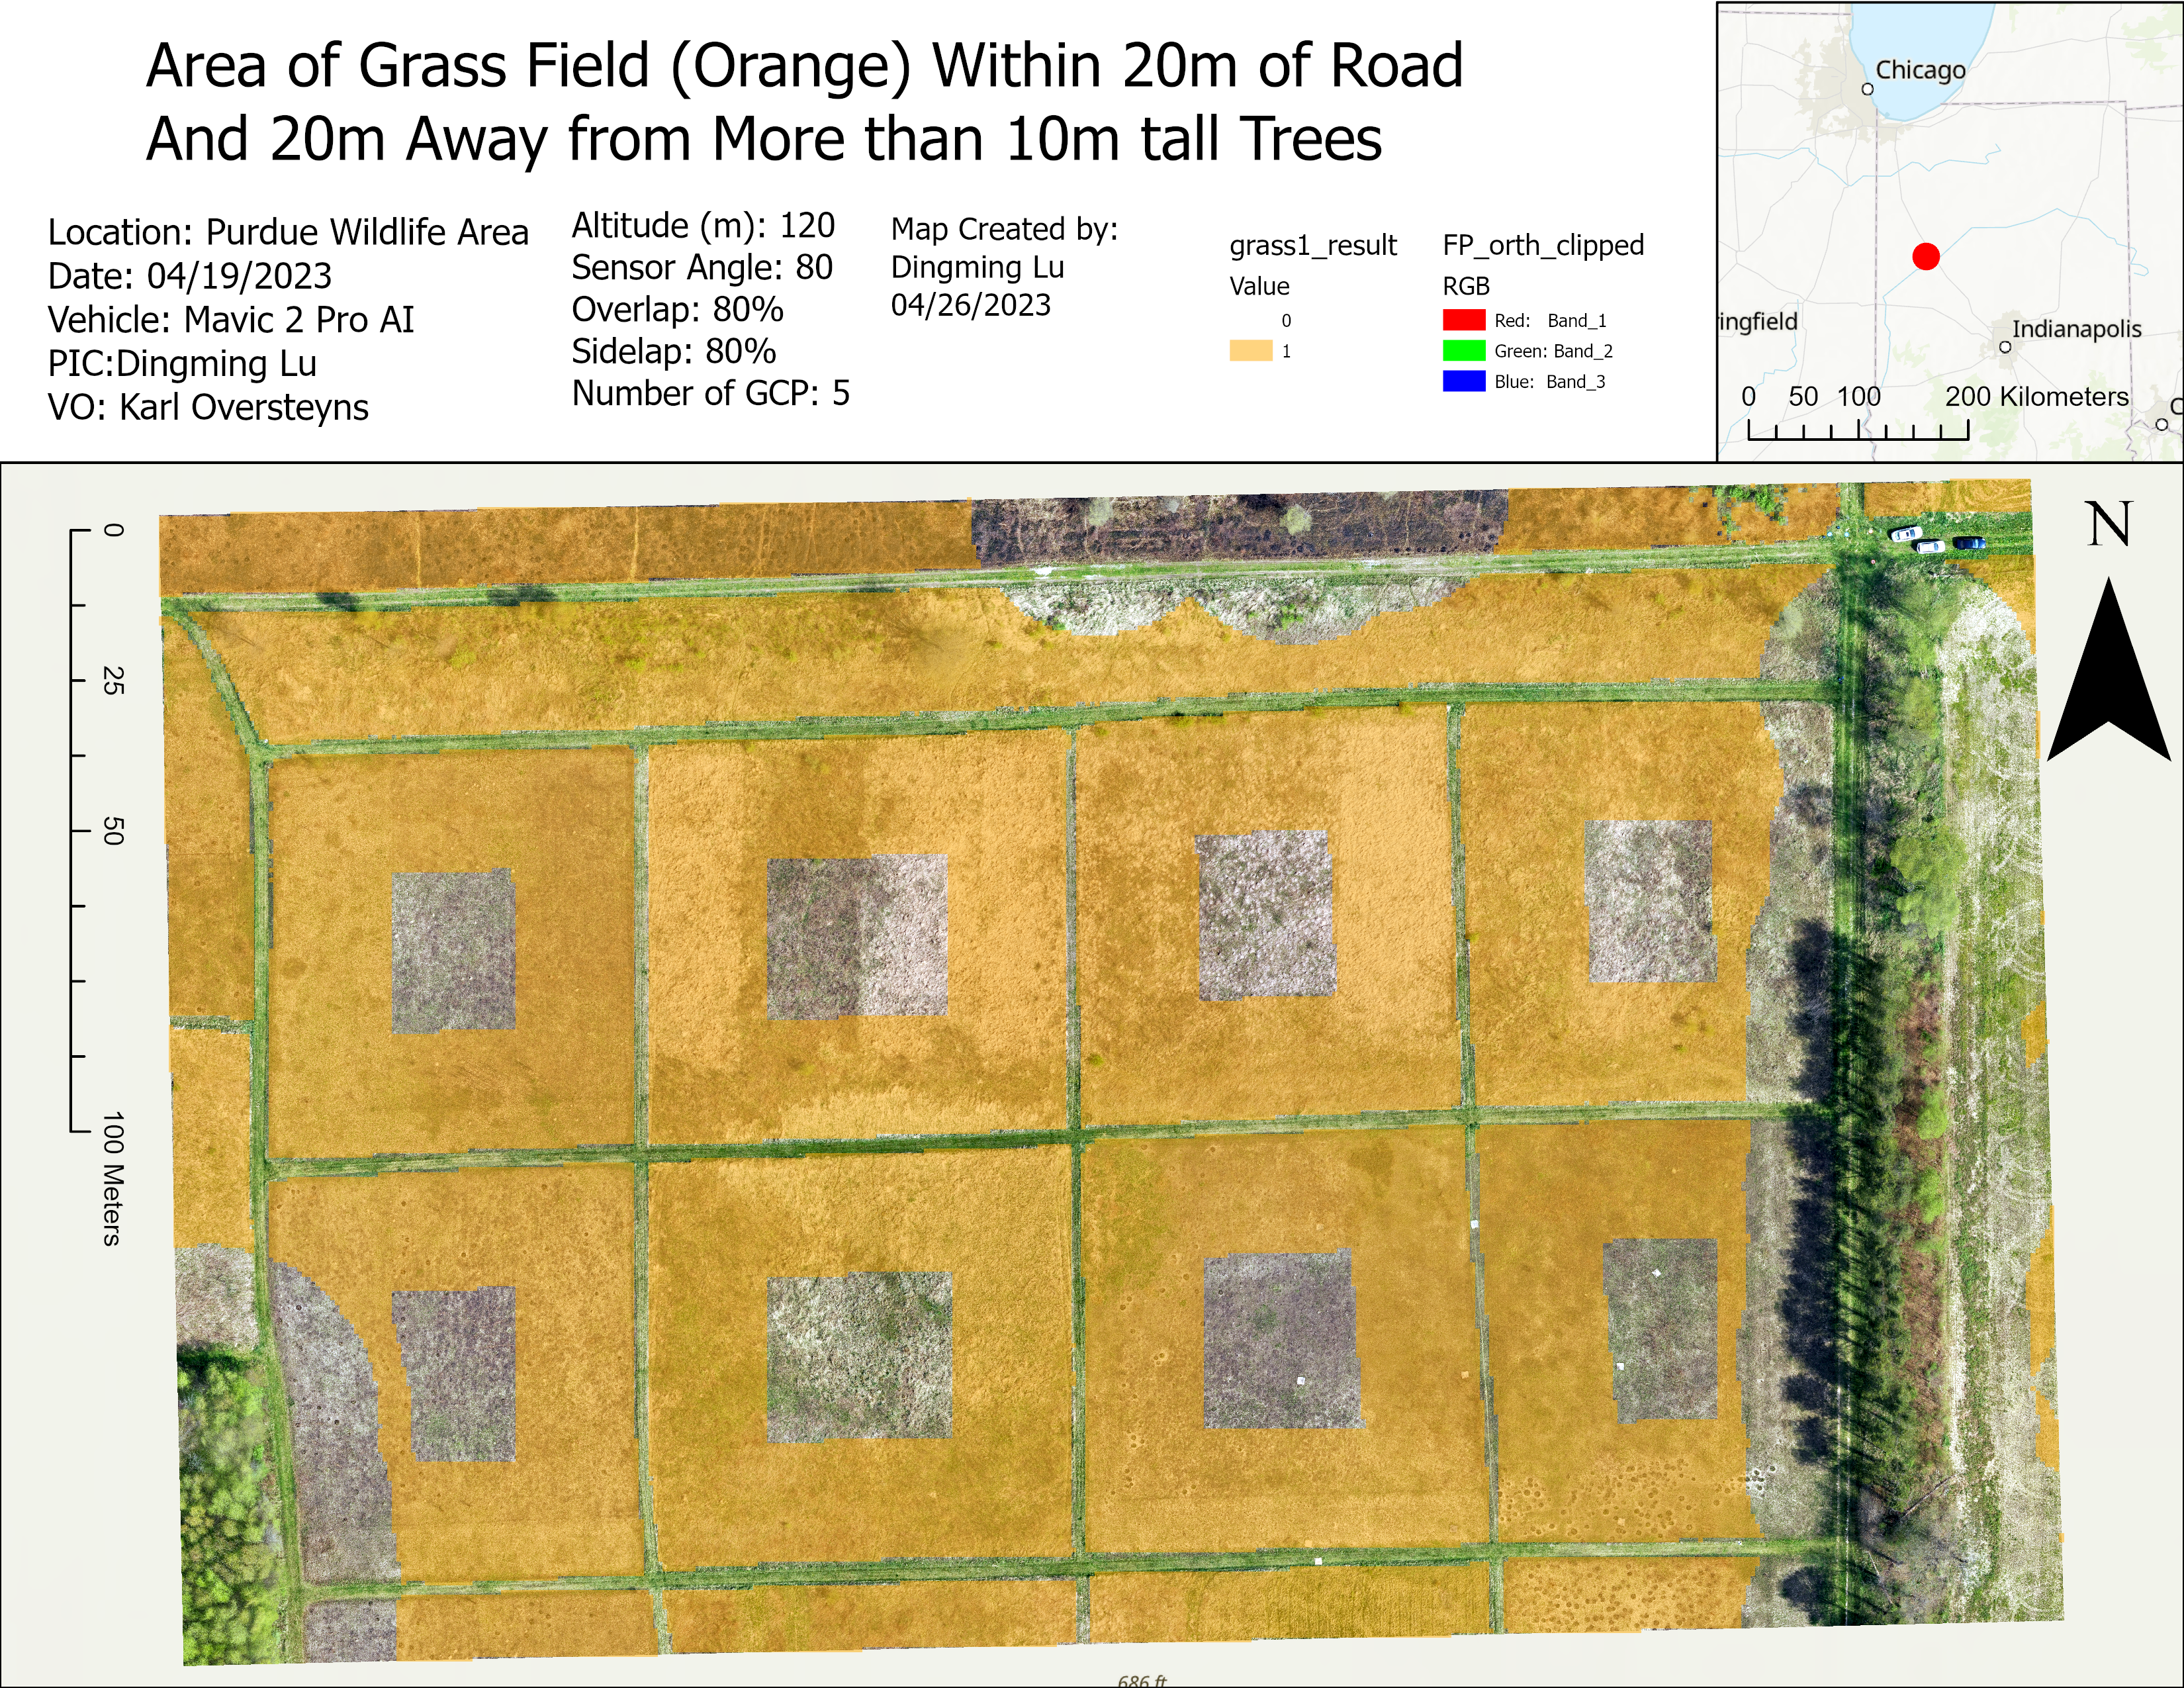
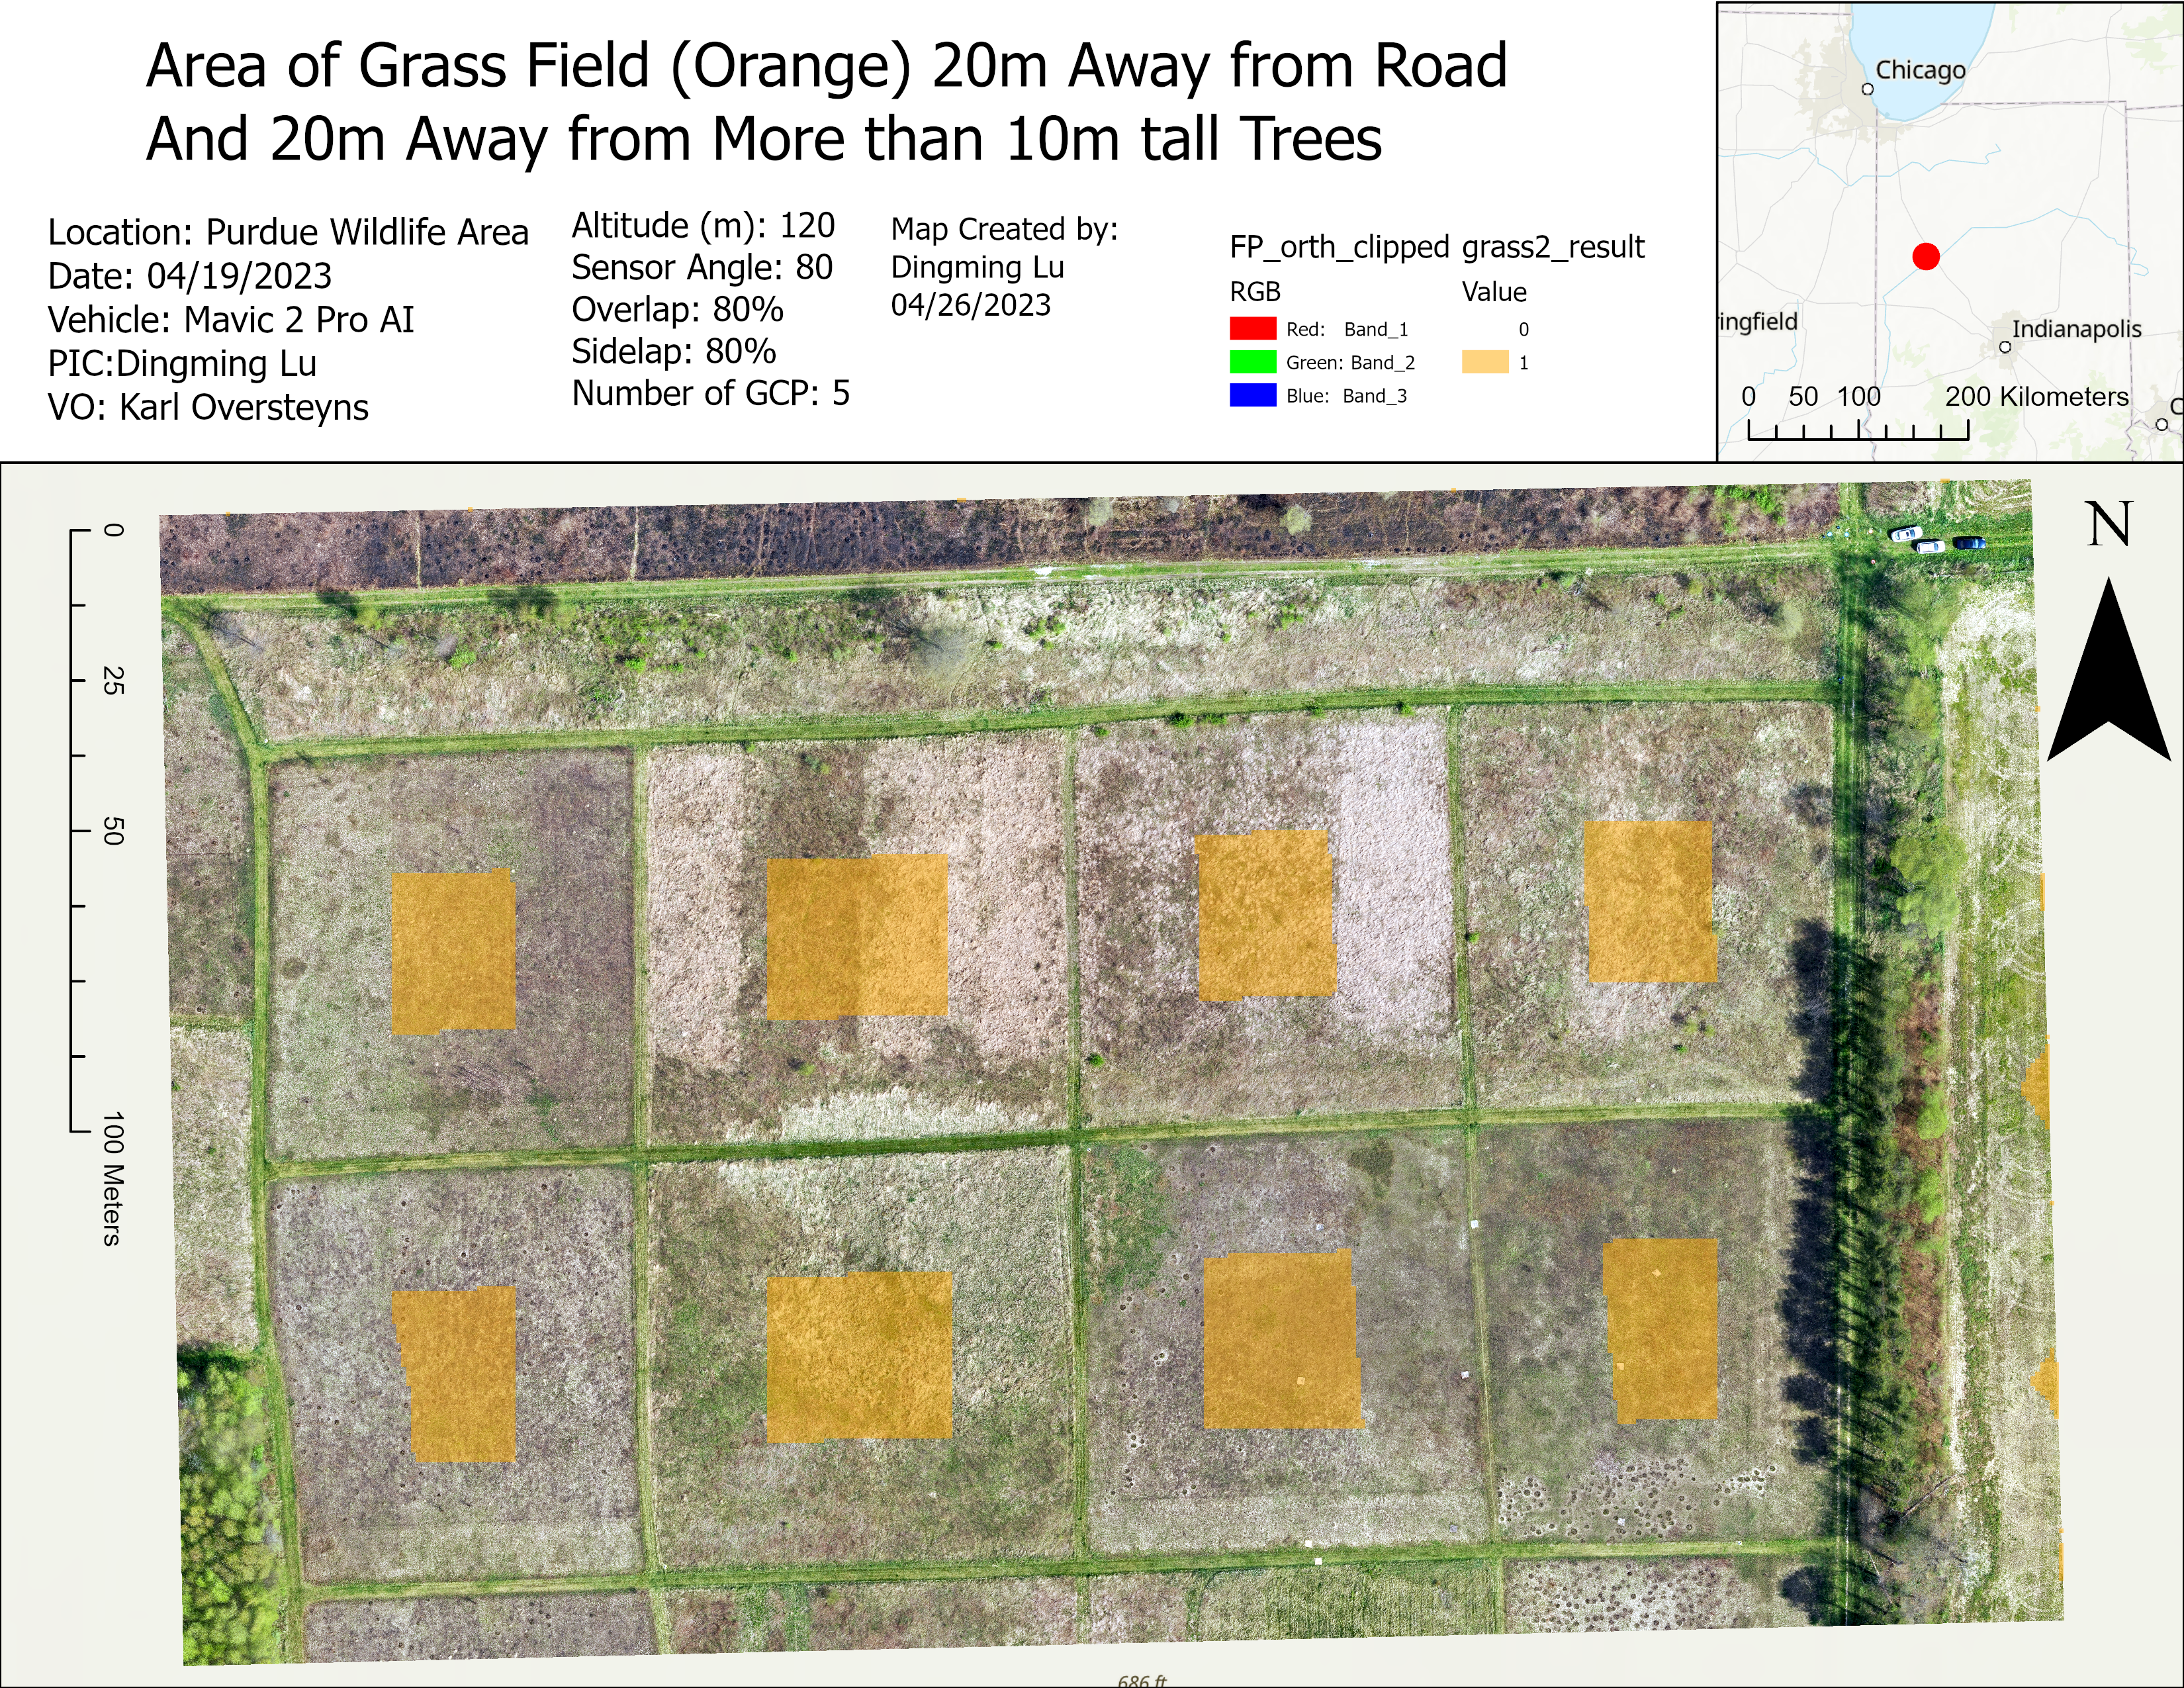
We need to find these areas:
- Requirement 1:
- Grass that within 20 meters of the road
- And 20 meters away from trees that are more than 10 meters high
- Requirement 2:
- Grass that is 20 meters away from the road
- And 20 meters away from trees that are more than 10 meters high
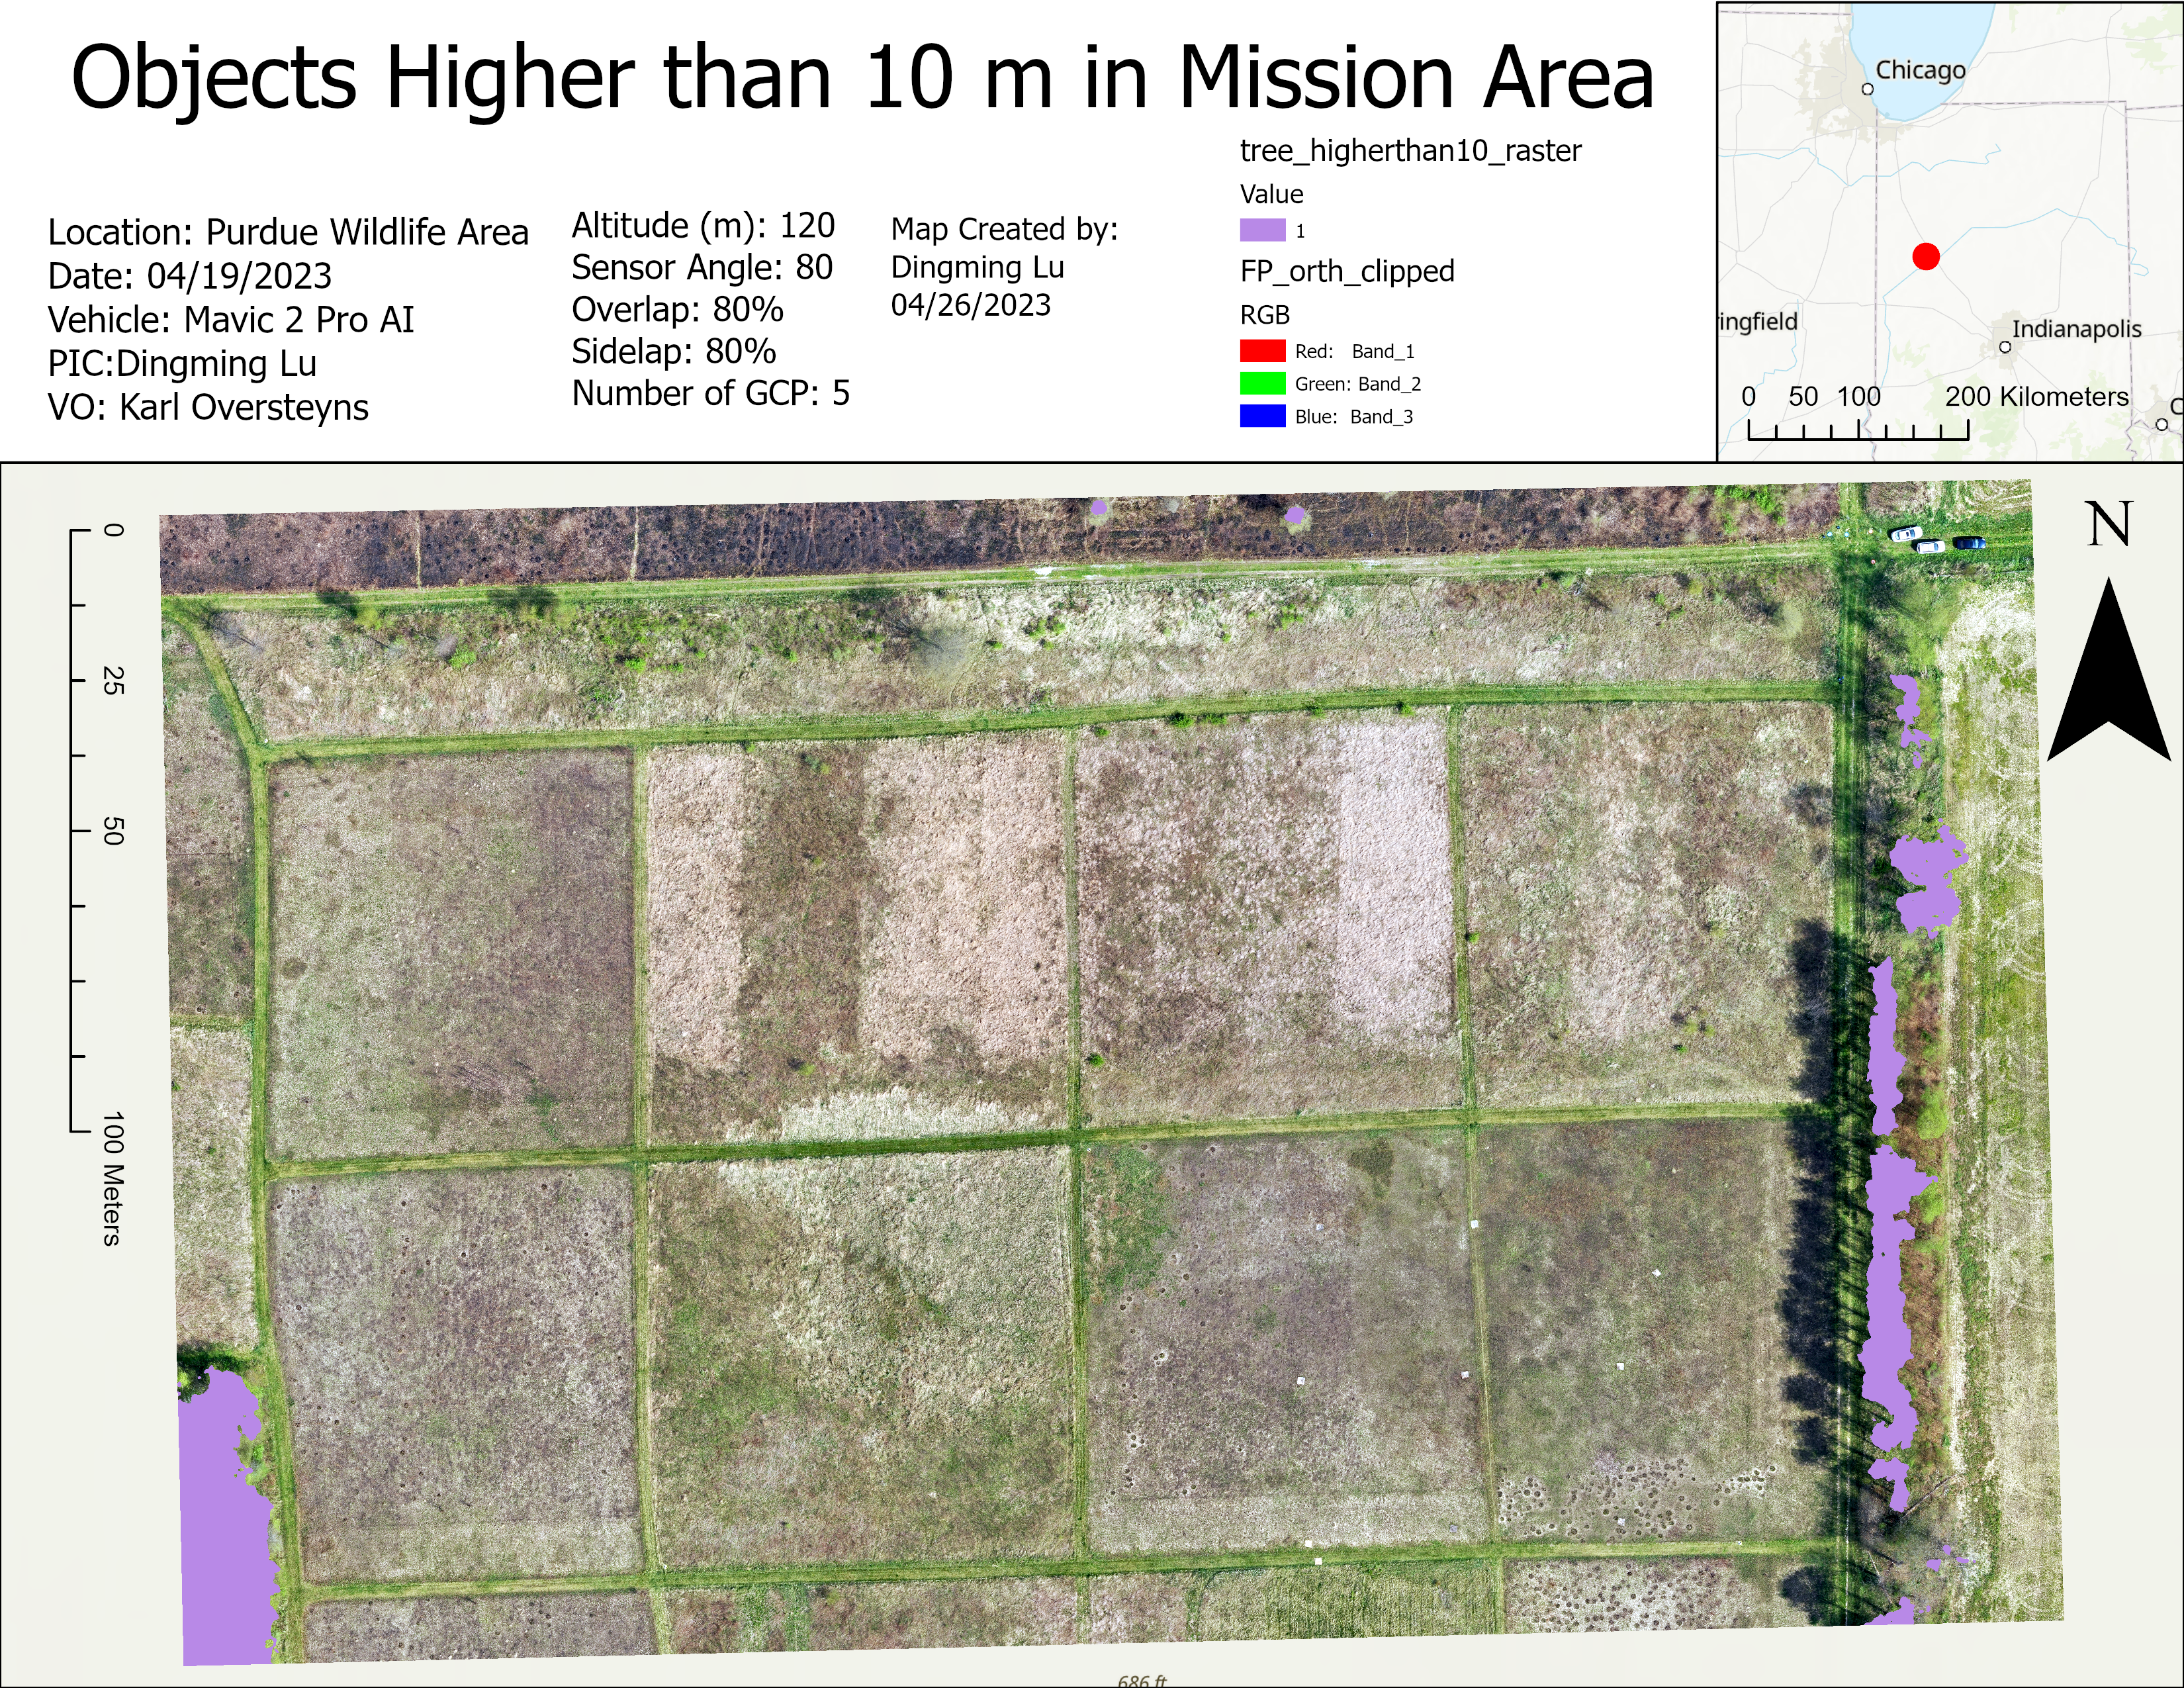
To do this, we need to find trees that are more than 10 meters high by using when the DSM data is larger than the elevation + 10 meters.
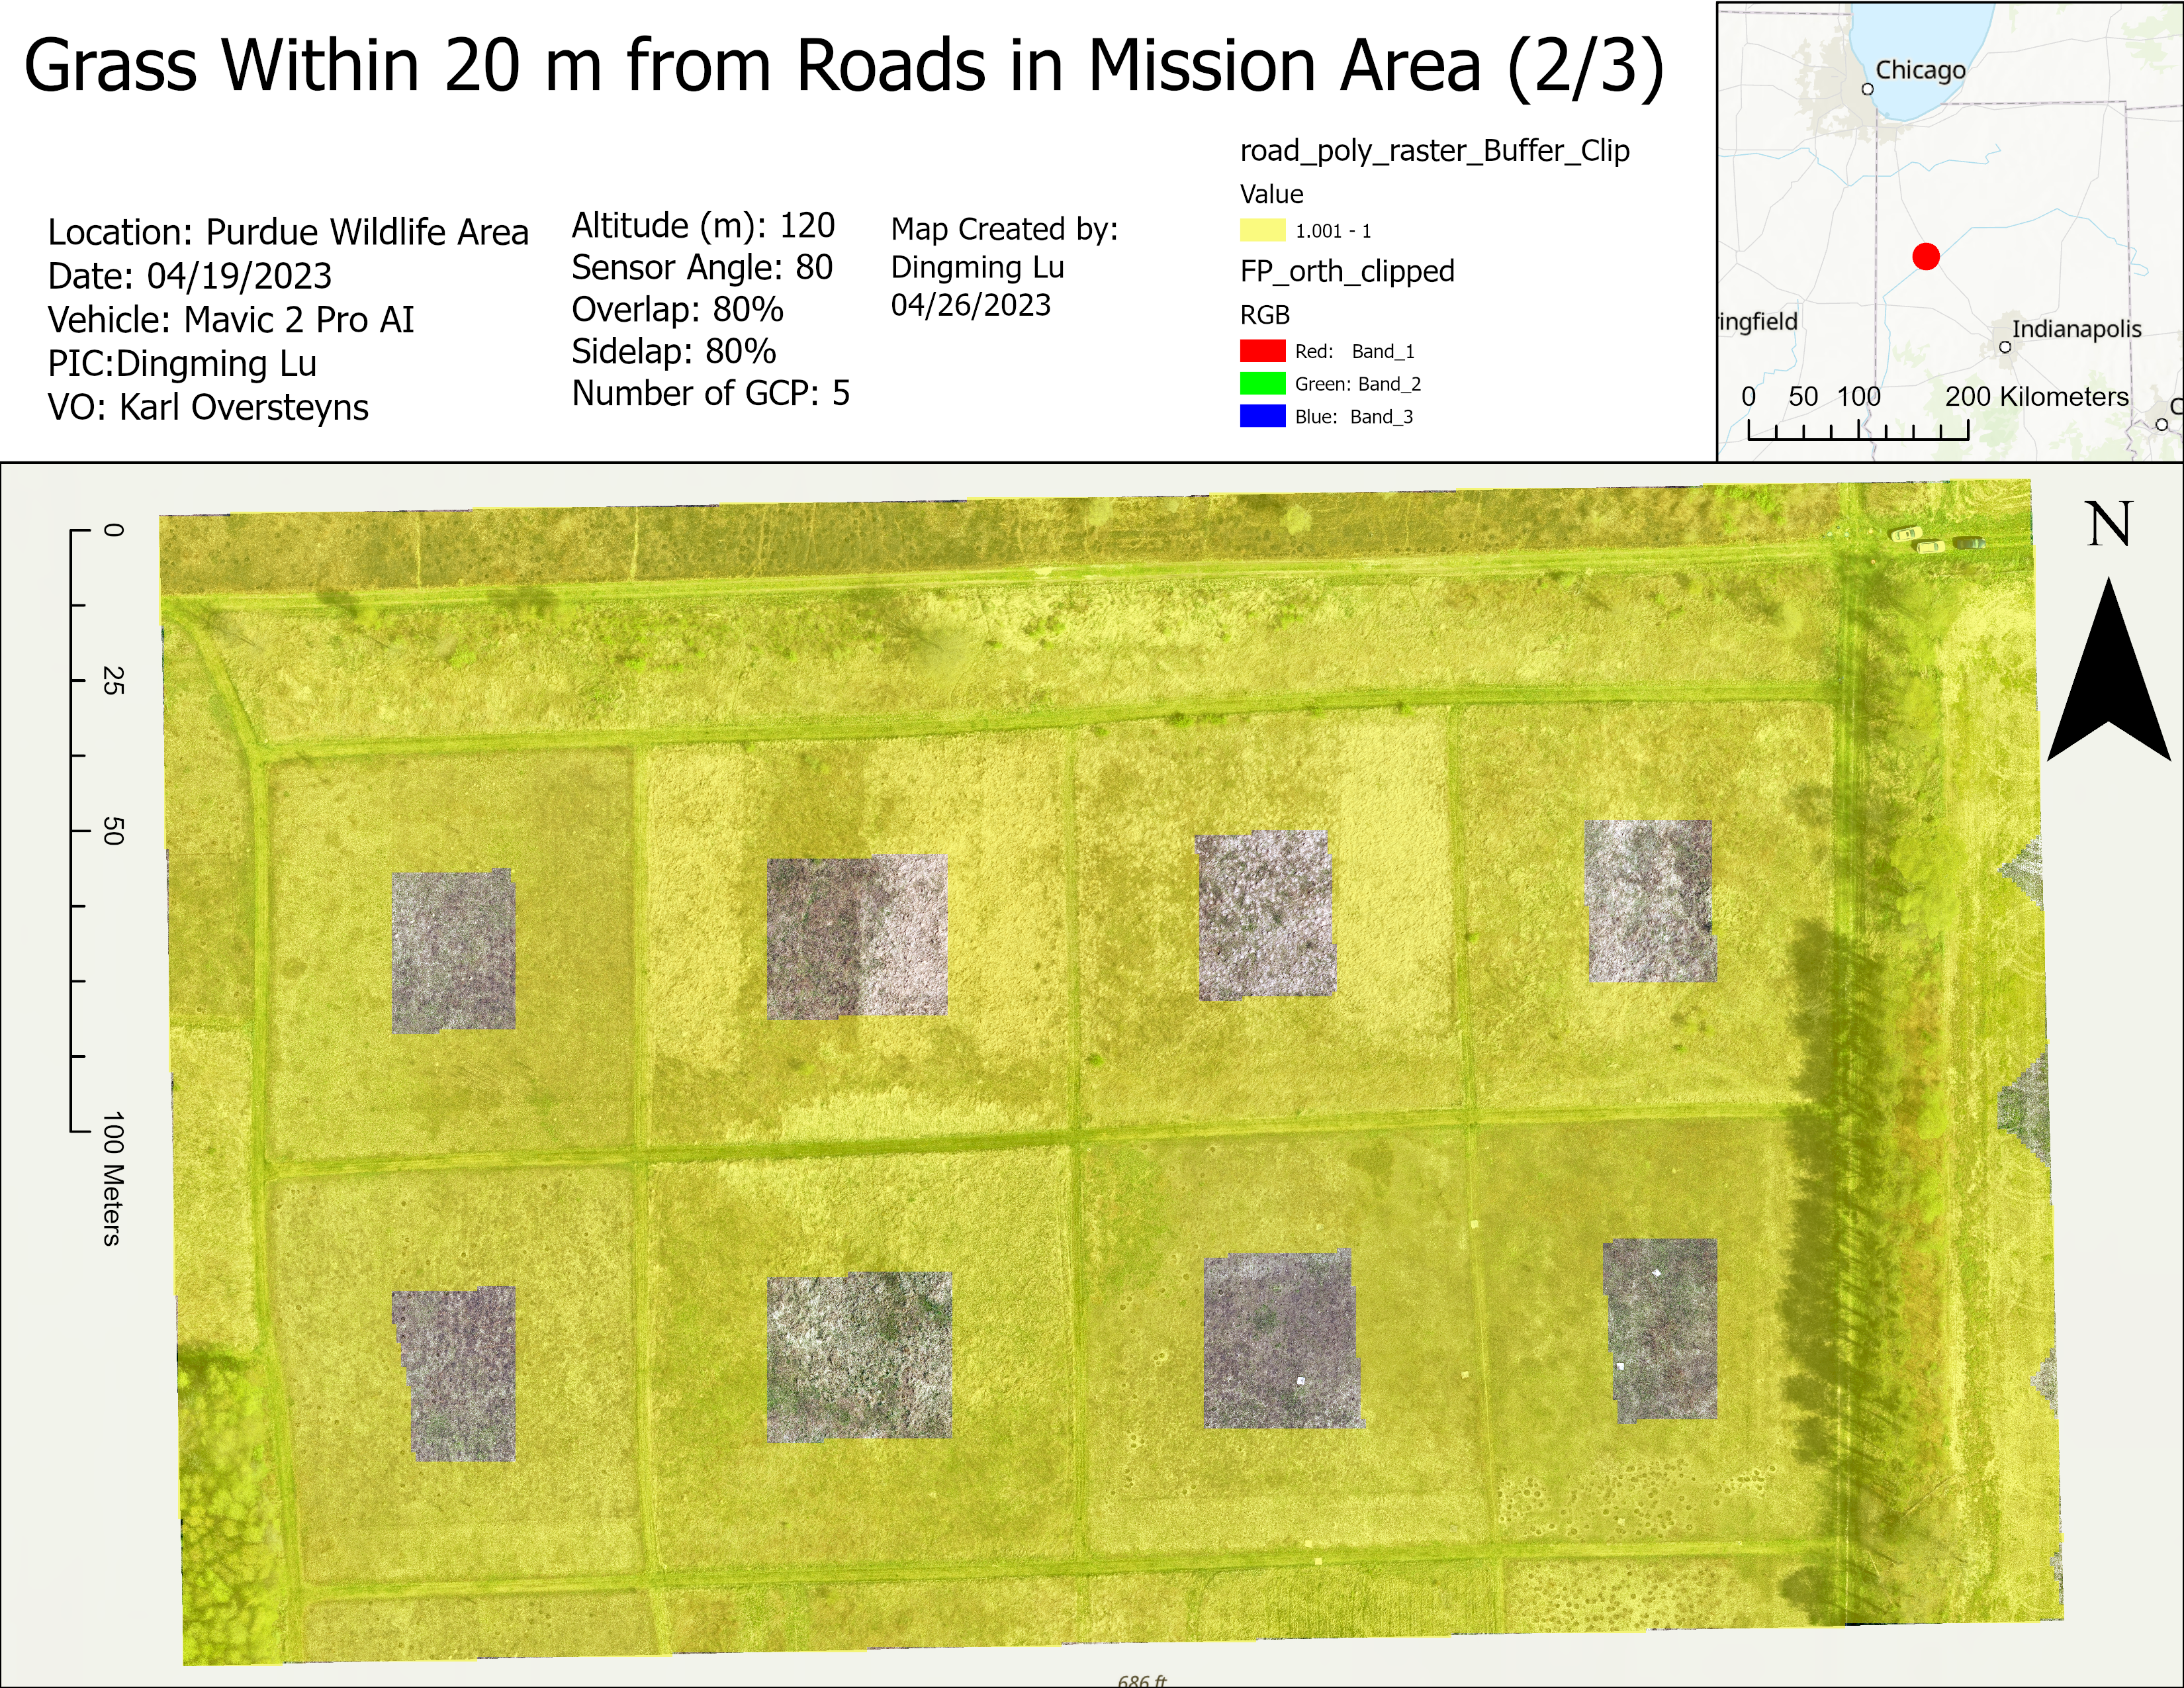
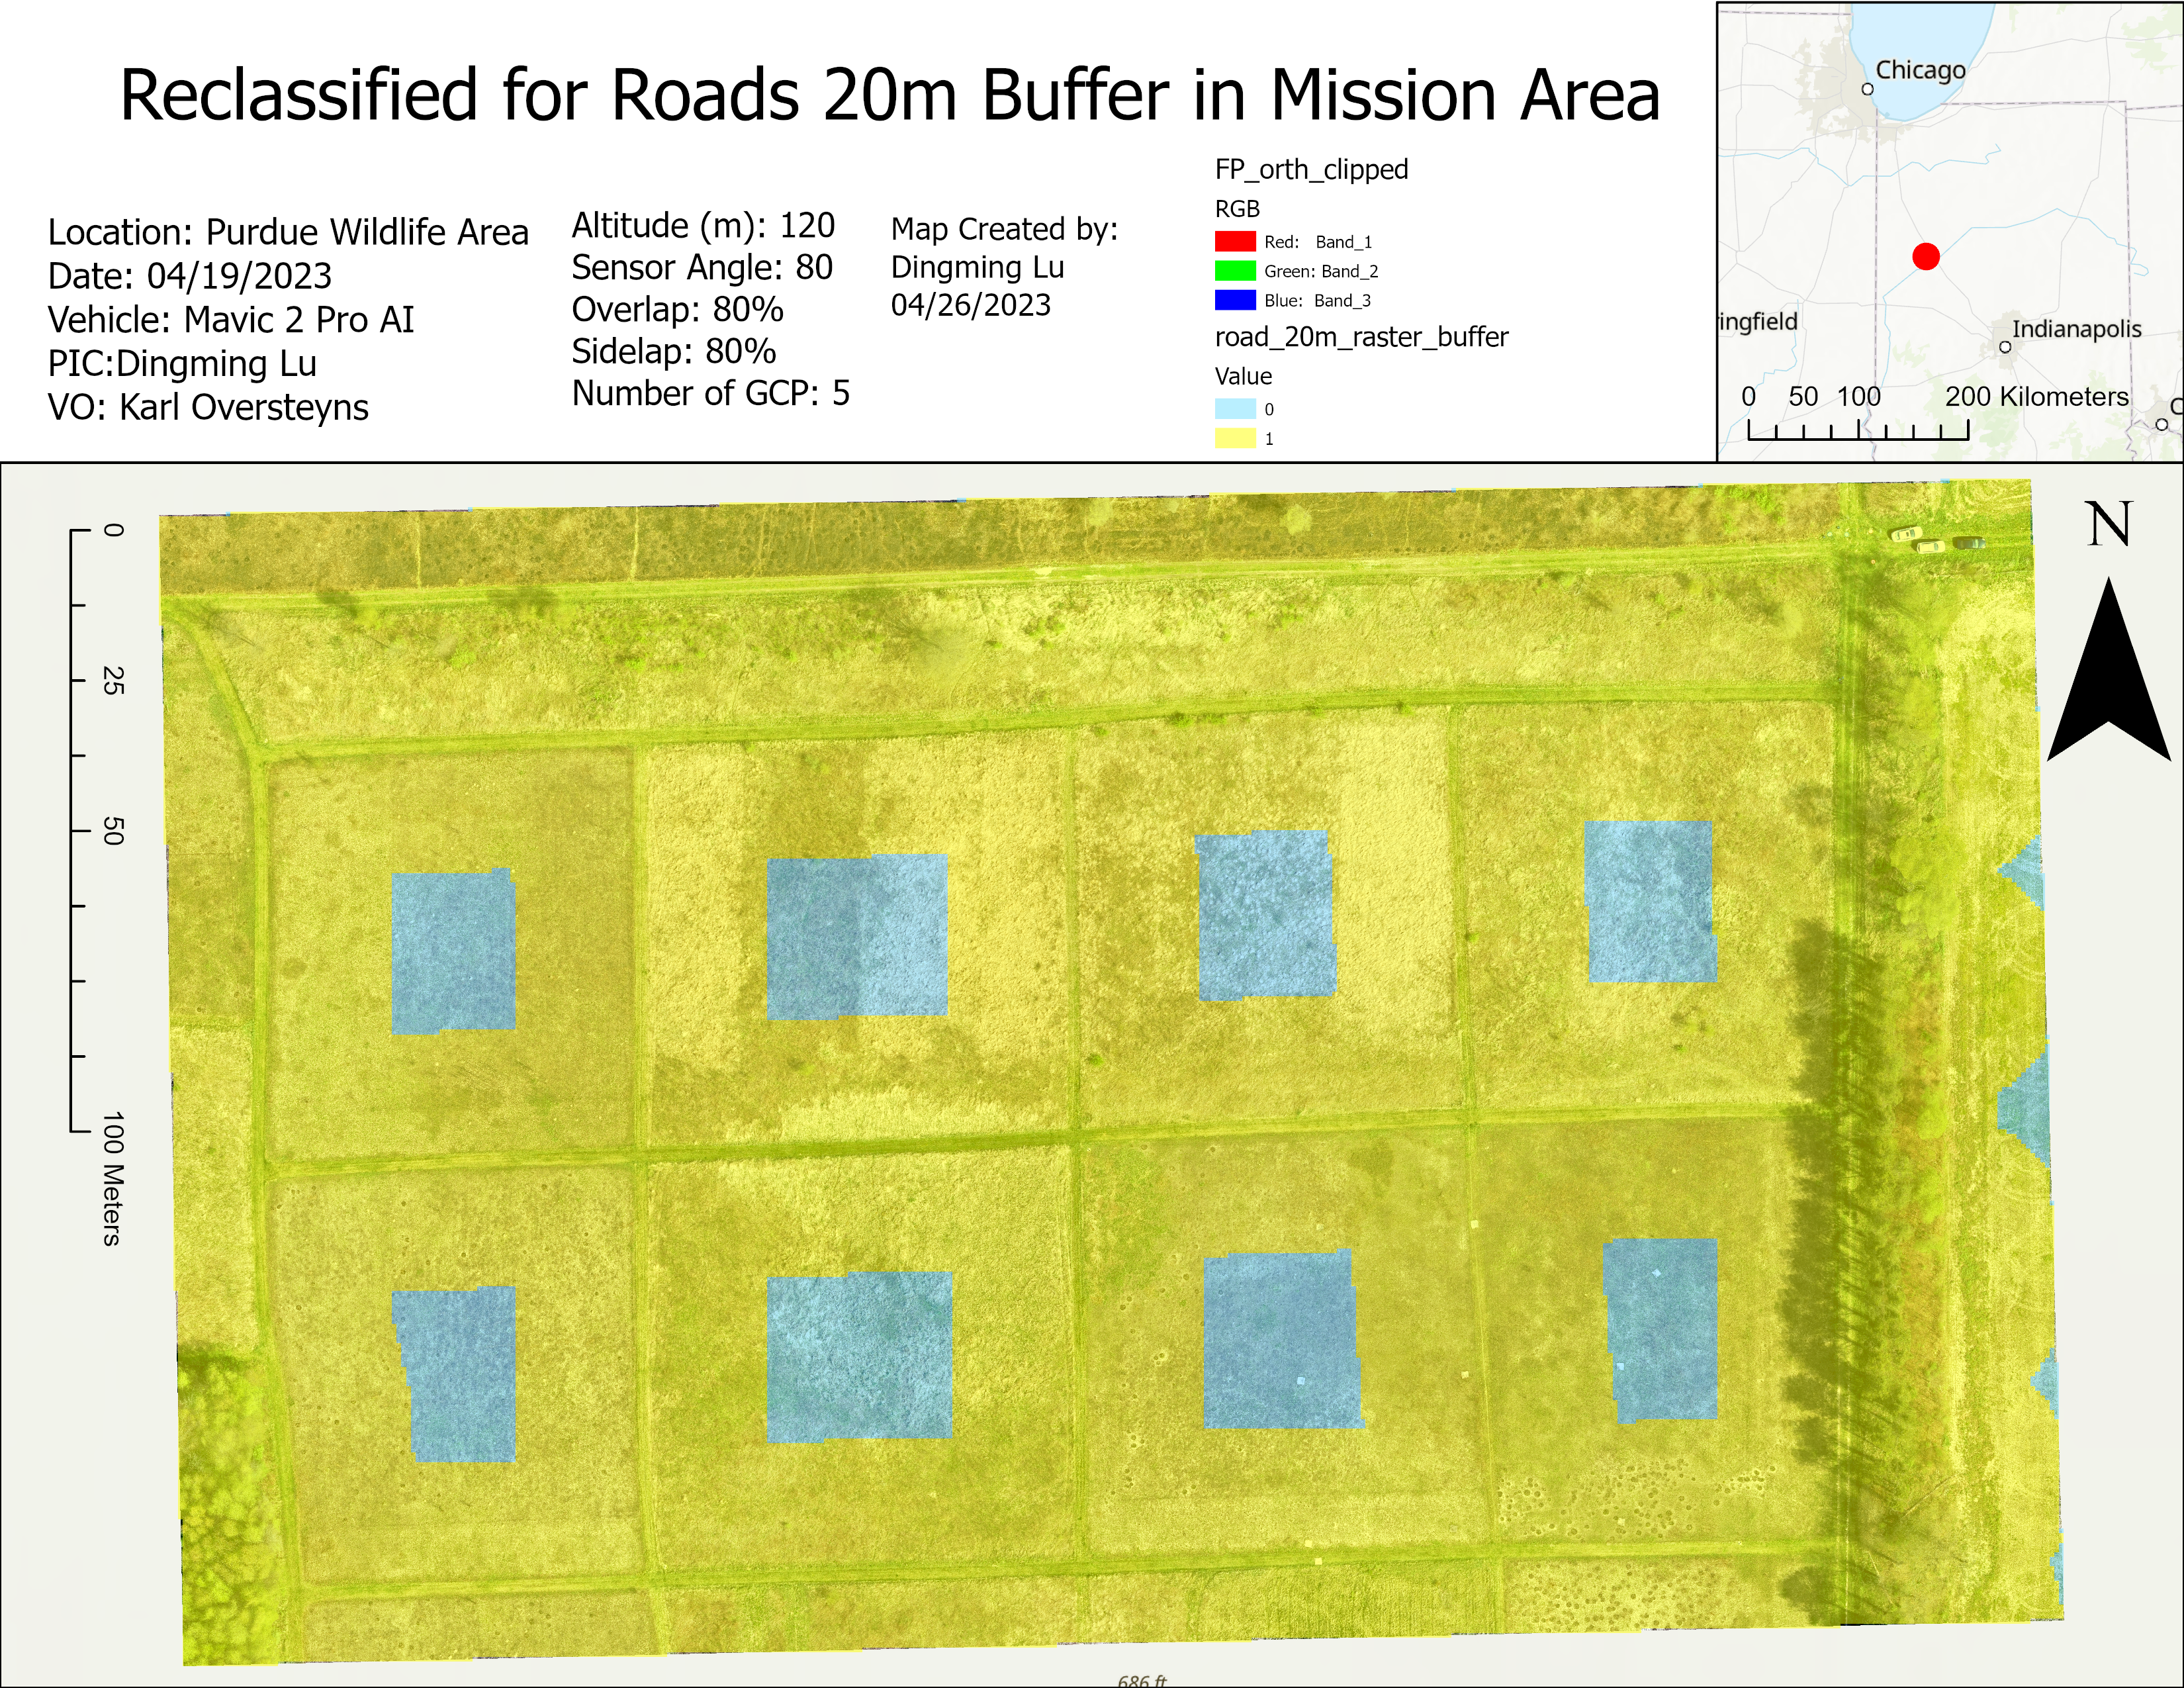
Then convert raster road to polygon -> create 20 m buffer -> clip -> convert back to raster -> reclassify to have both 1 and 0.
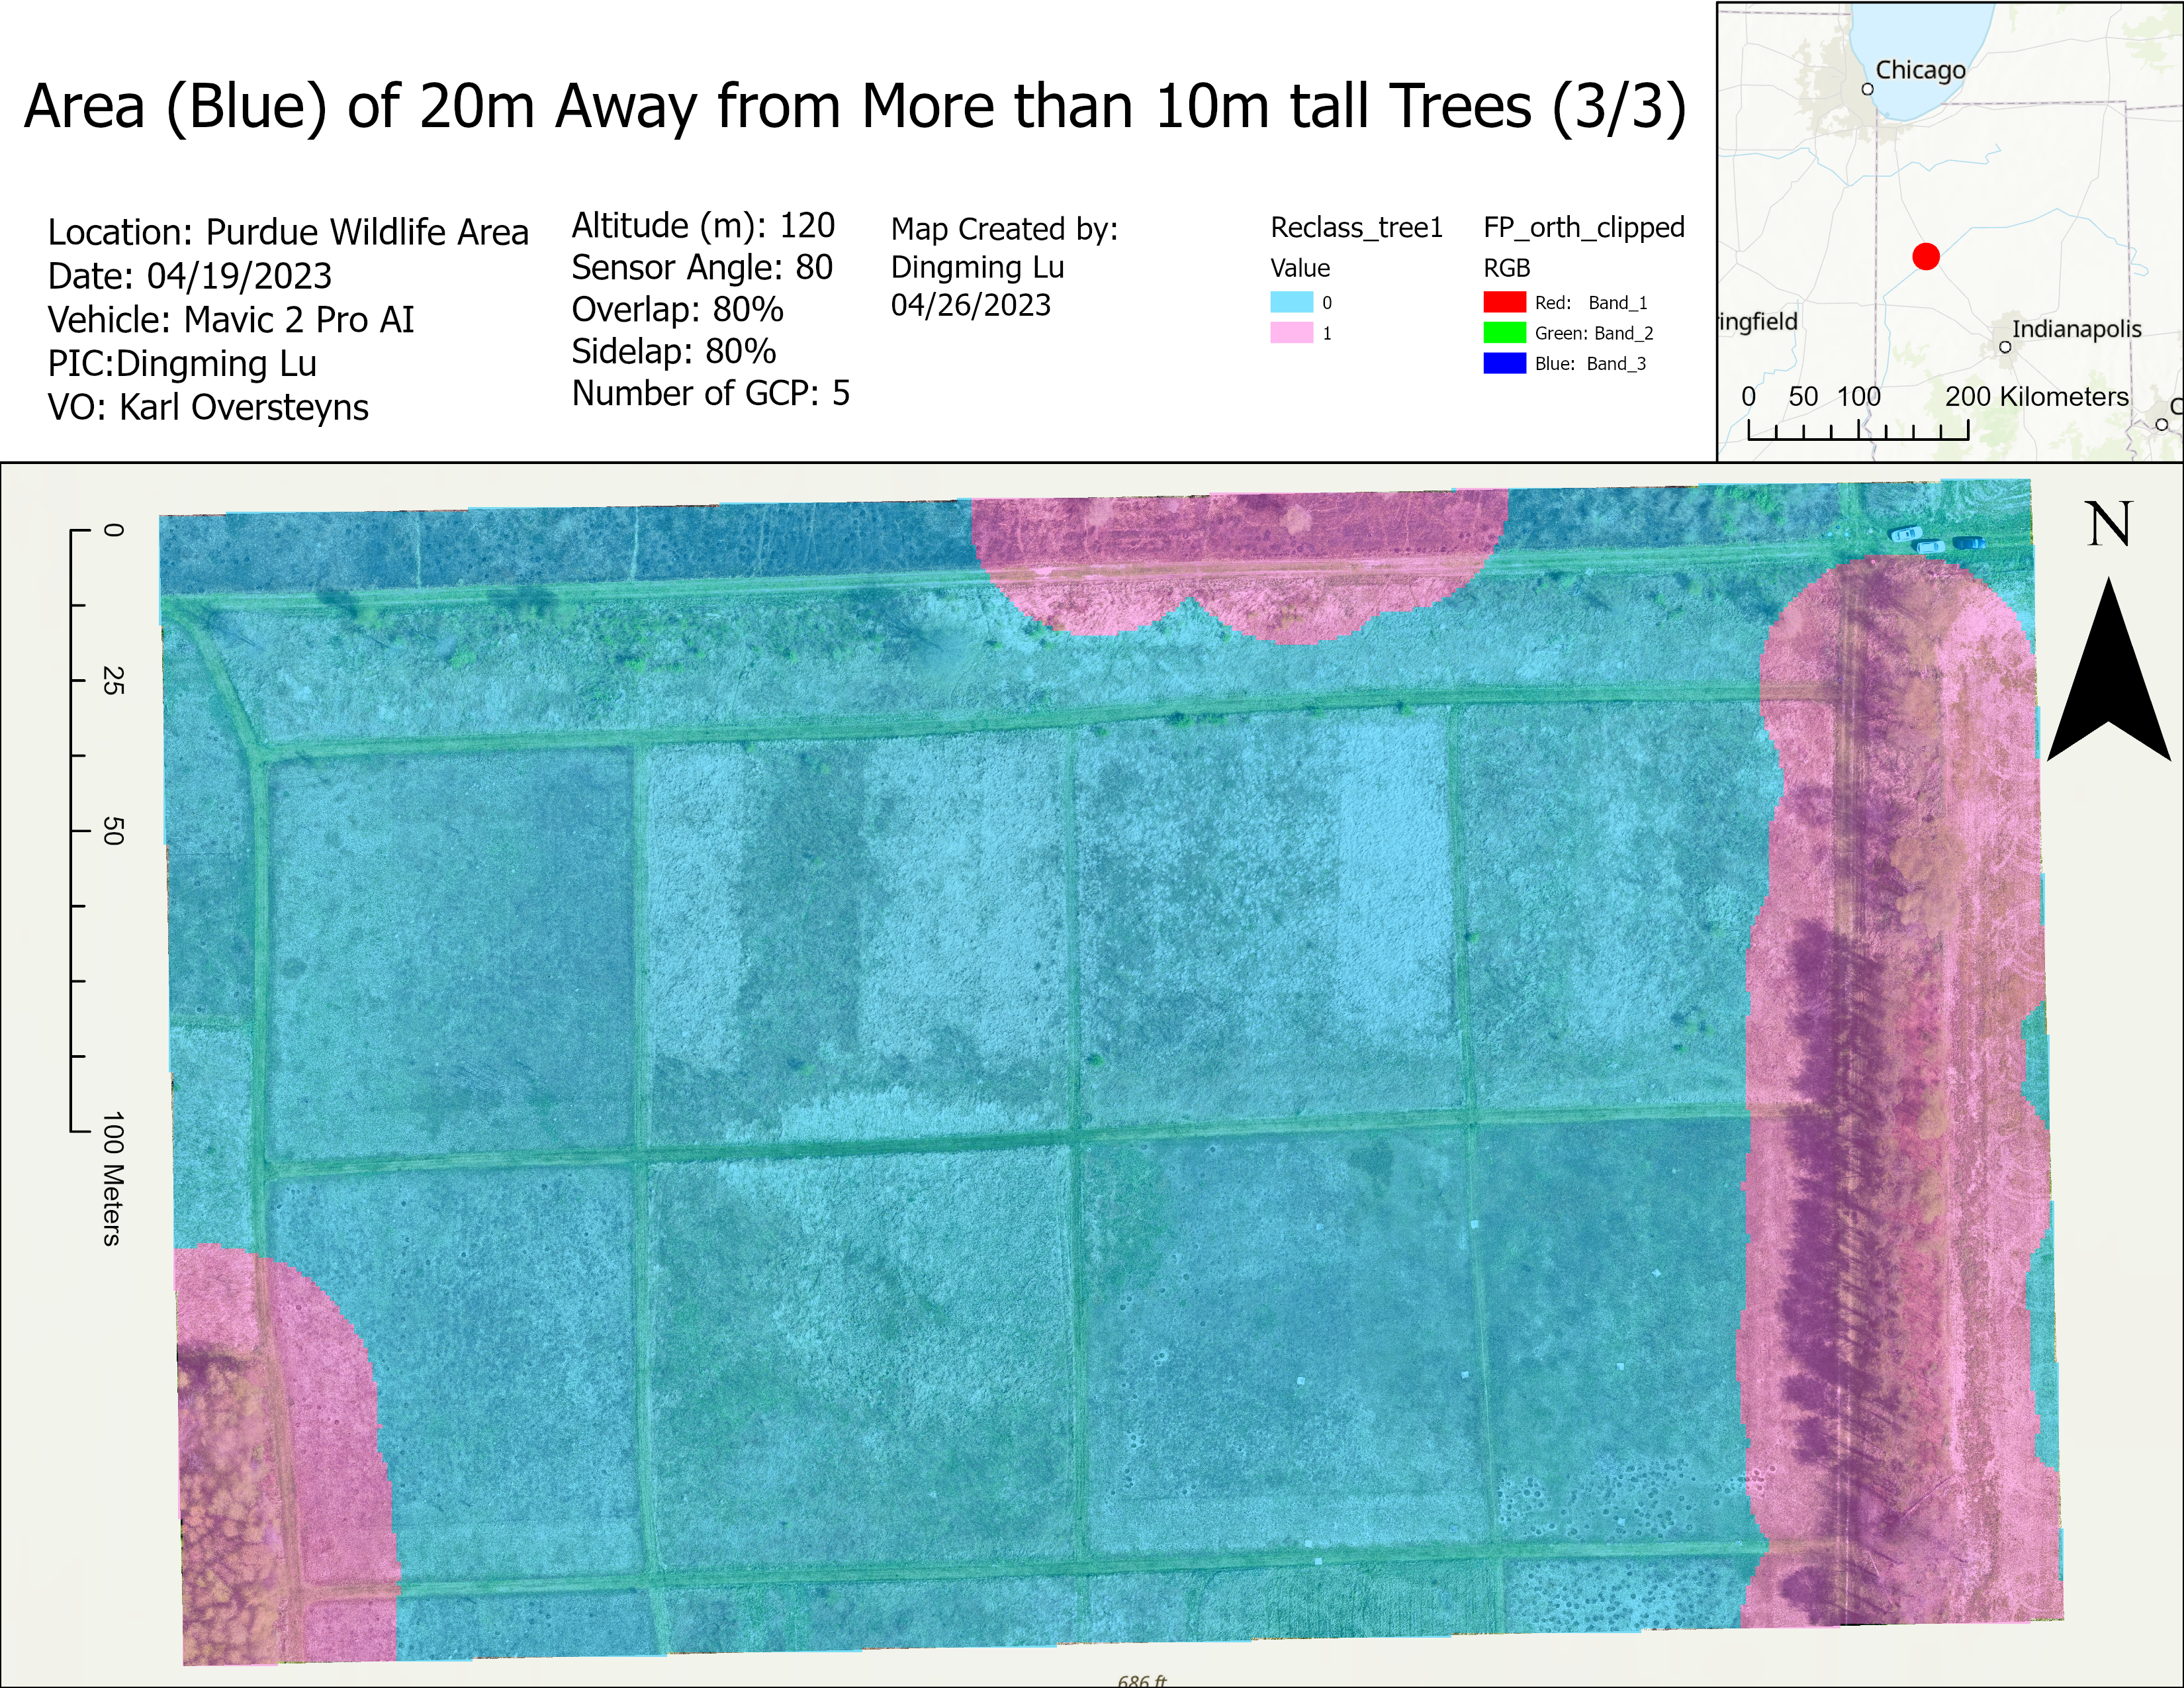
Then convert tall trees to polygon -> create 20 m buffer -> clip -> convert back to raster -> reclassify to have both 1 and 0.
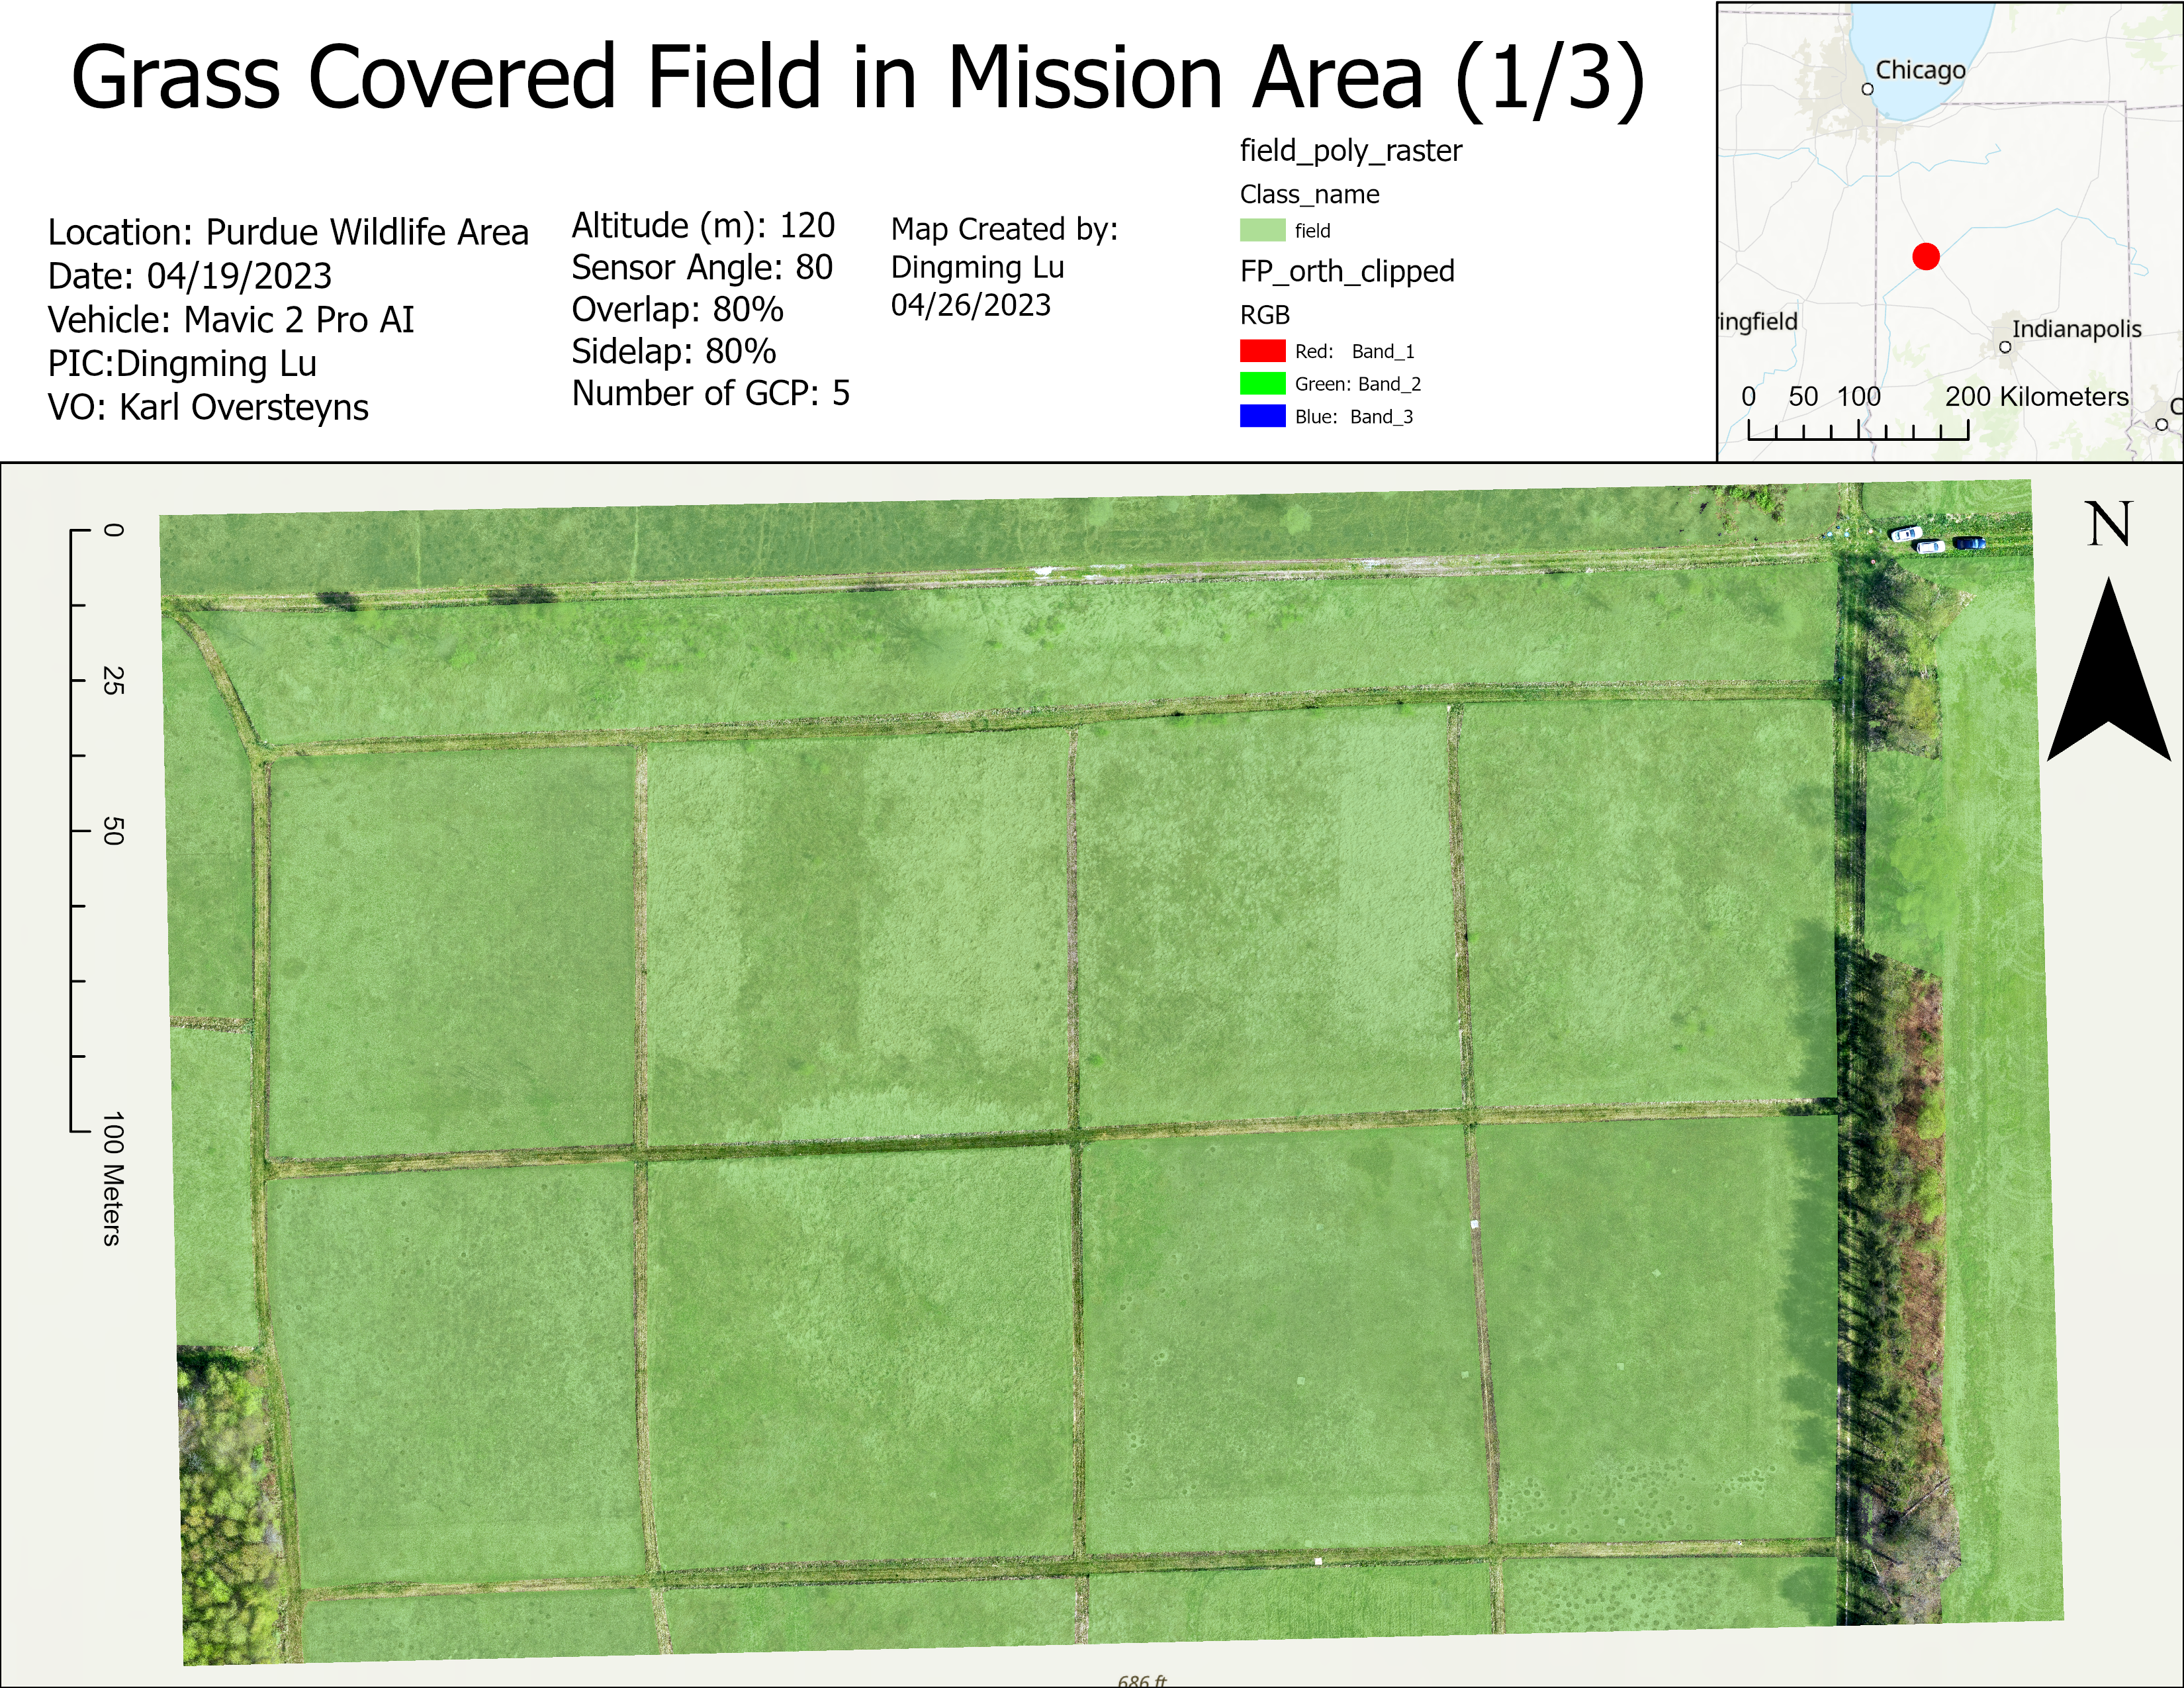
Extract the field from the classification.
To achieve part 1, we need the logic of (Area 20 m away from trees ) AND (Road buffer) AND (Field).
To achieve part 2, we need the logic of (Area 20 m away from trees ) AND (Area other than Road buffer) AND (Field).
