I. Intro
Date: 03/22/2023
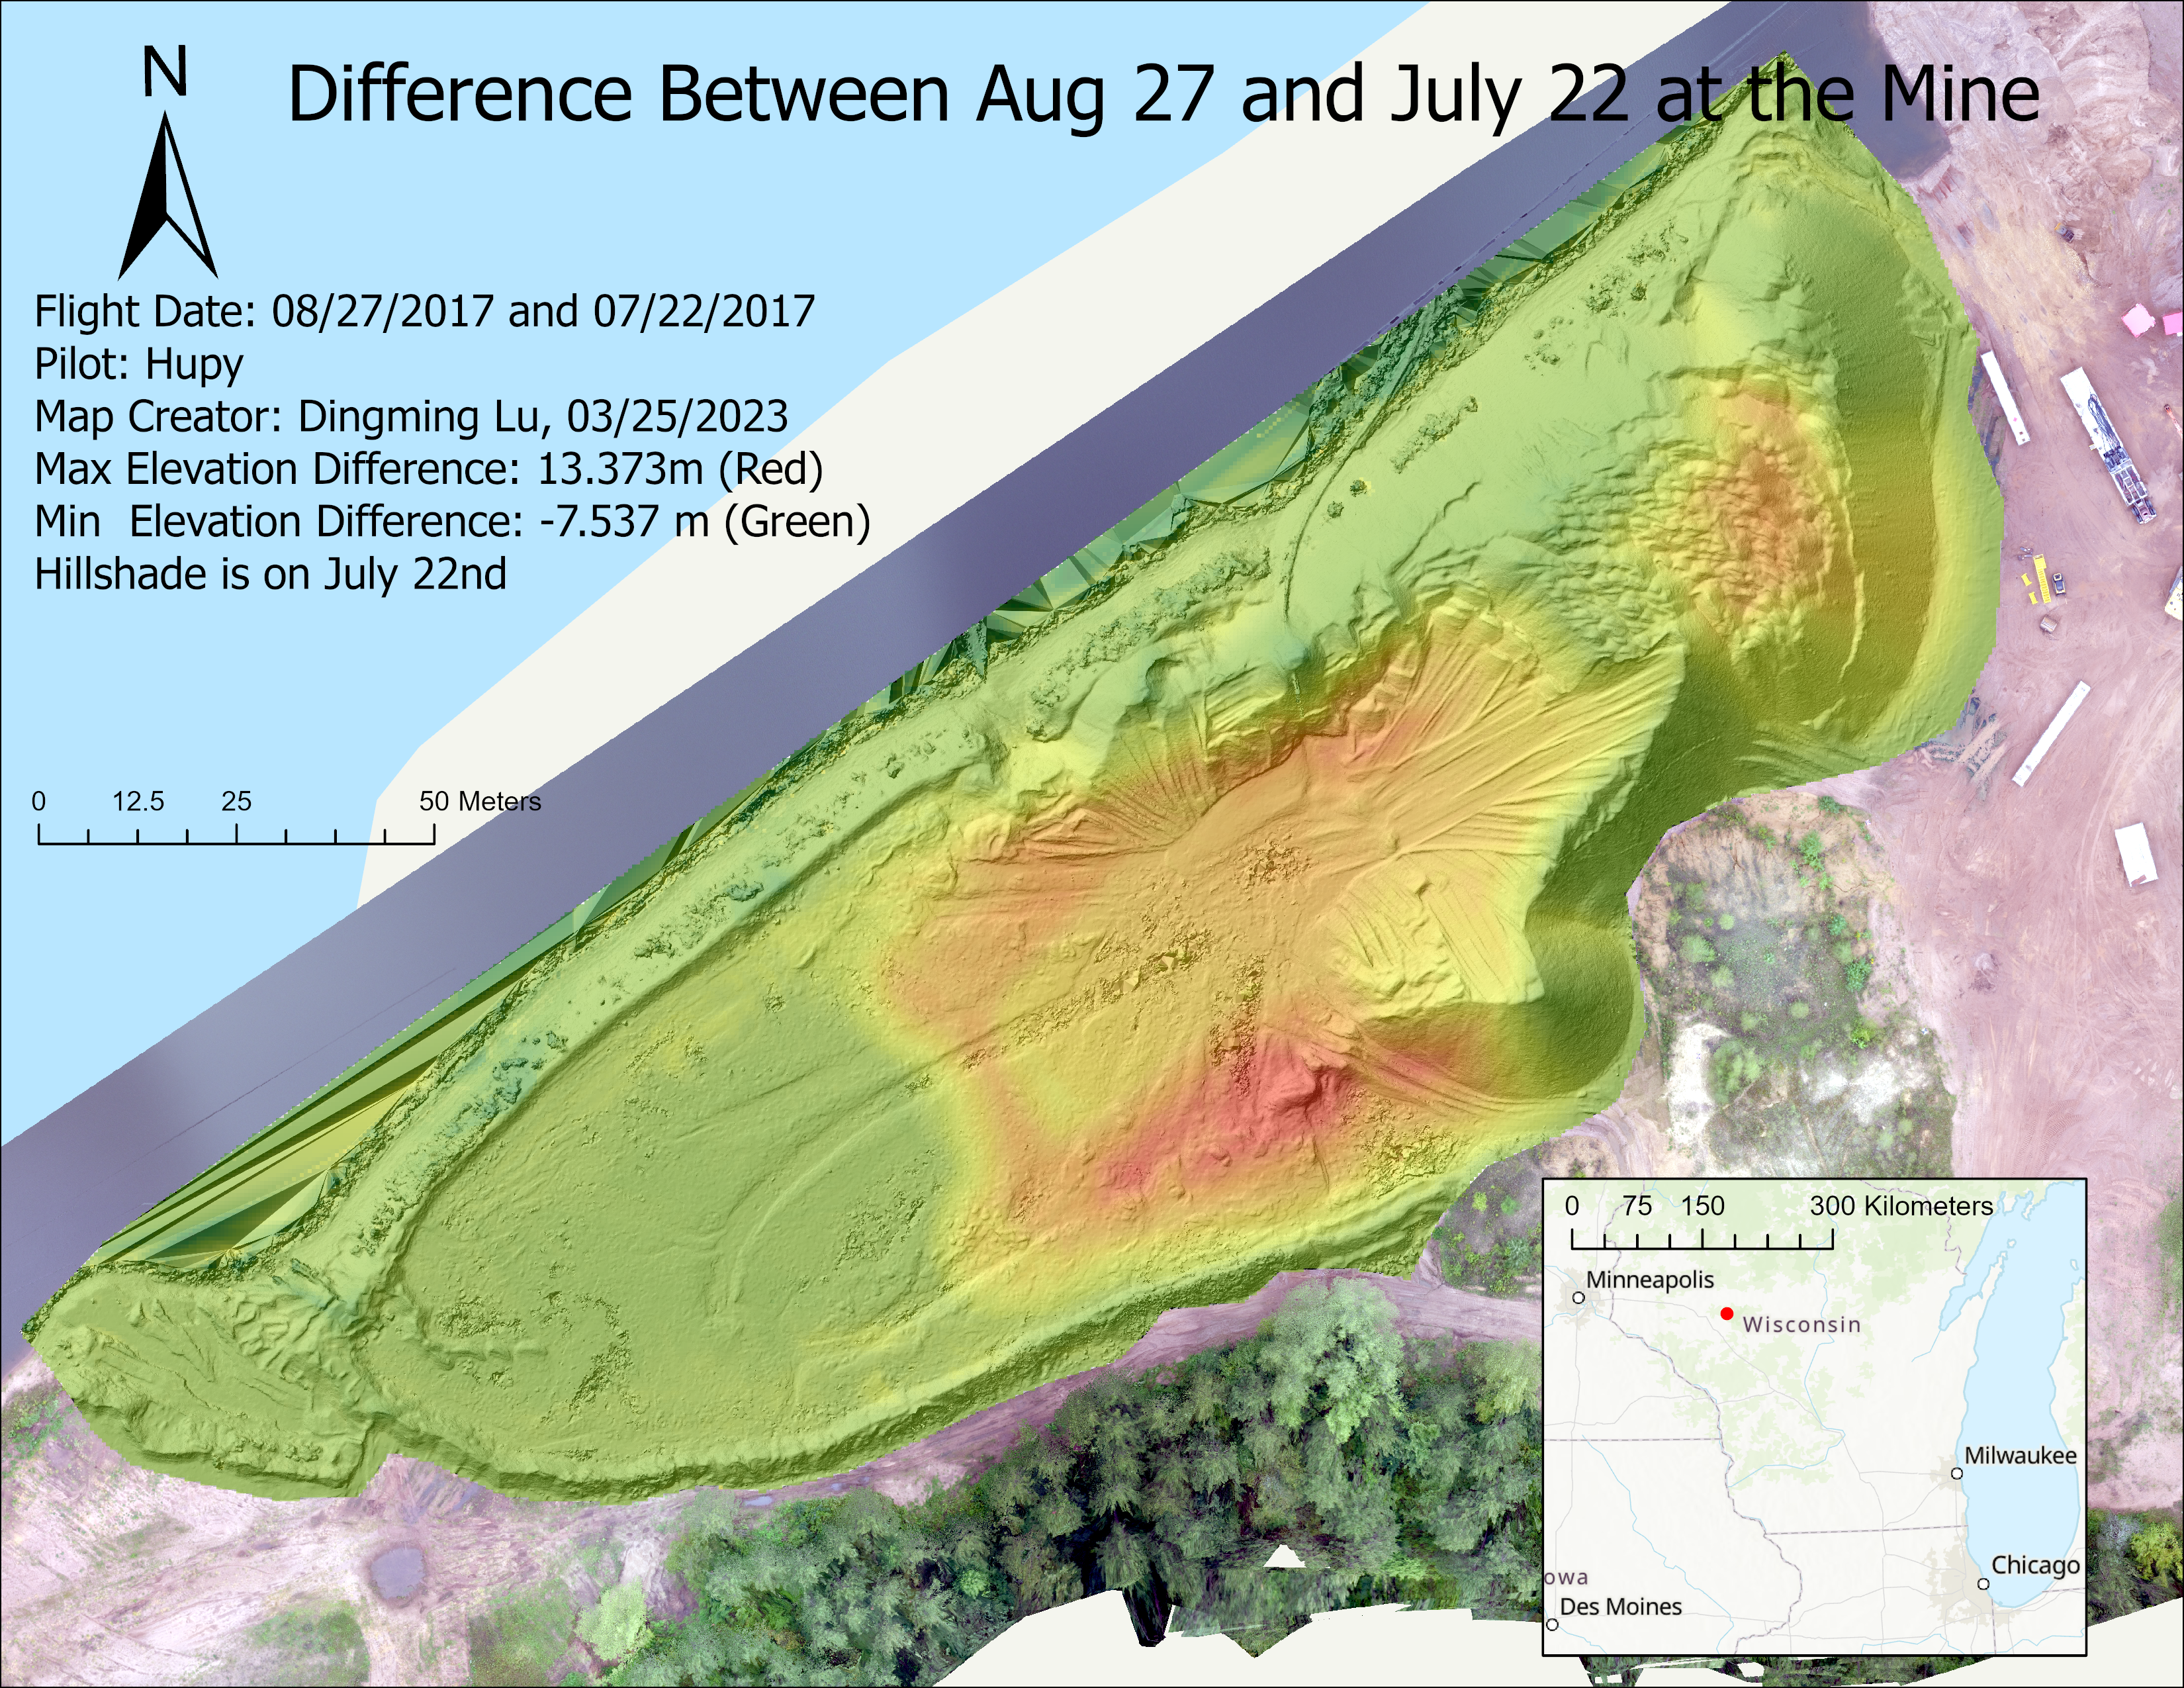
During the first lab, we worked with raster data. This data was gathered by Prof. Hupy in 2017 for a real world case. Three flights were on July 4th, July 22nd, and August 27. 0704, 0722, and 0827 will be used for short.
II. Prepare to Analysis
A. Extract by mask
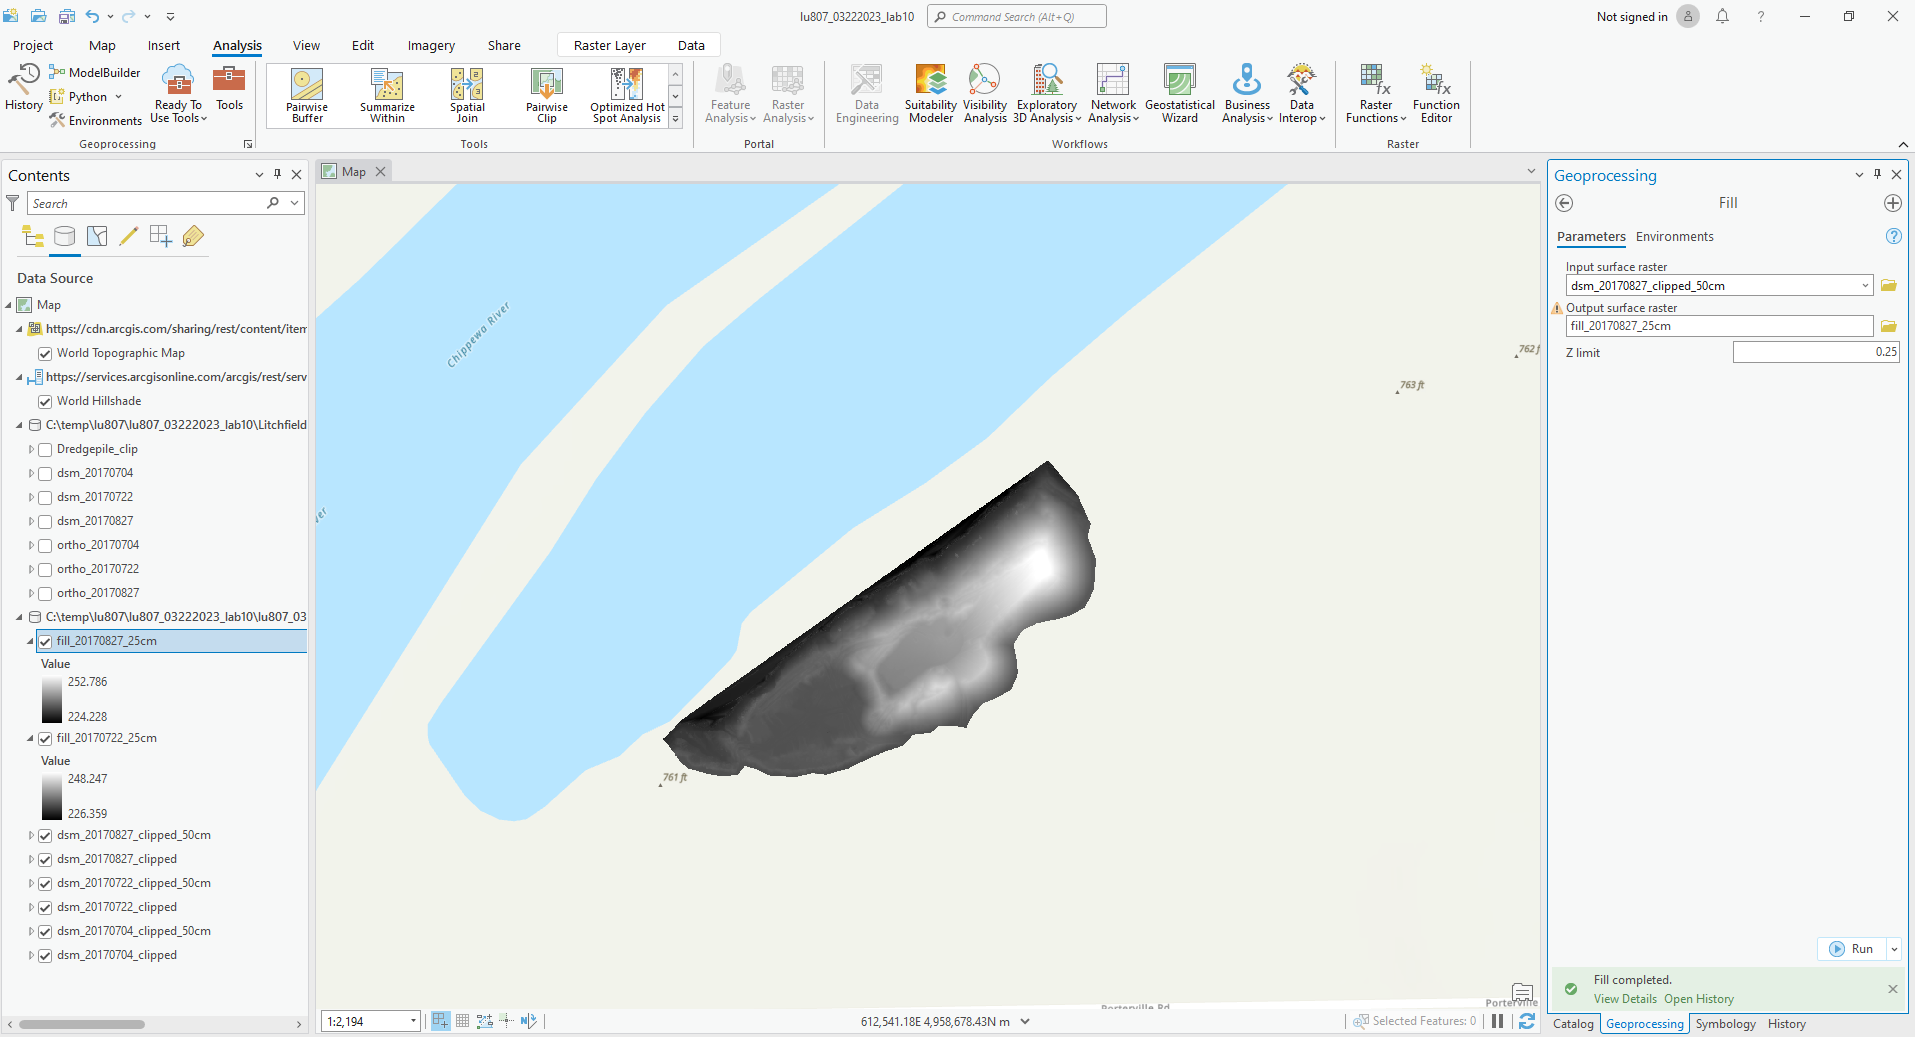
- The raster version of clip, it will keep the cells in the defined shape of combination of cells.
- Set input raster to the DSM data for each date.
- Set feature mask data to the clipping shape.
- Rename the output (noted with “clipped”).
B. Resample
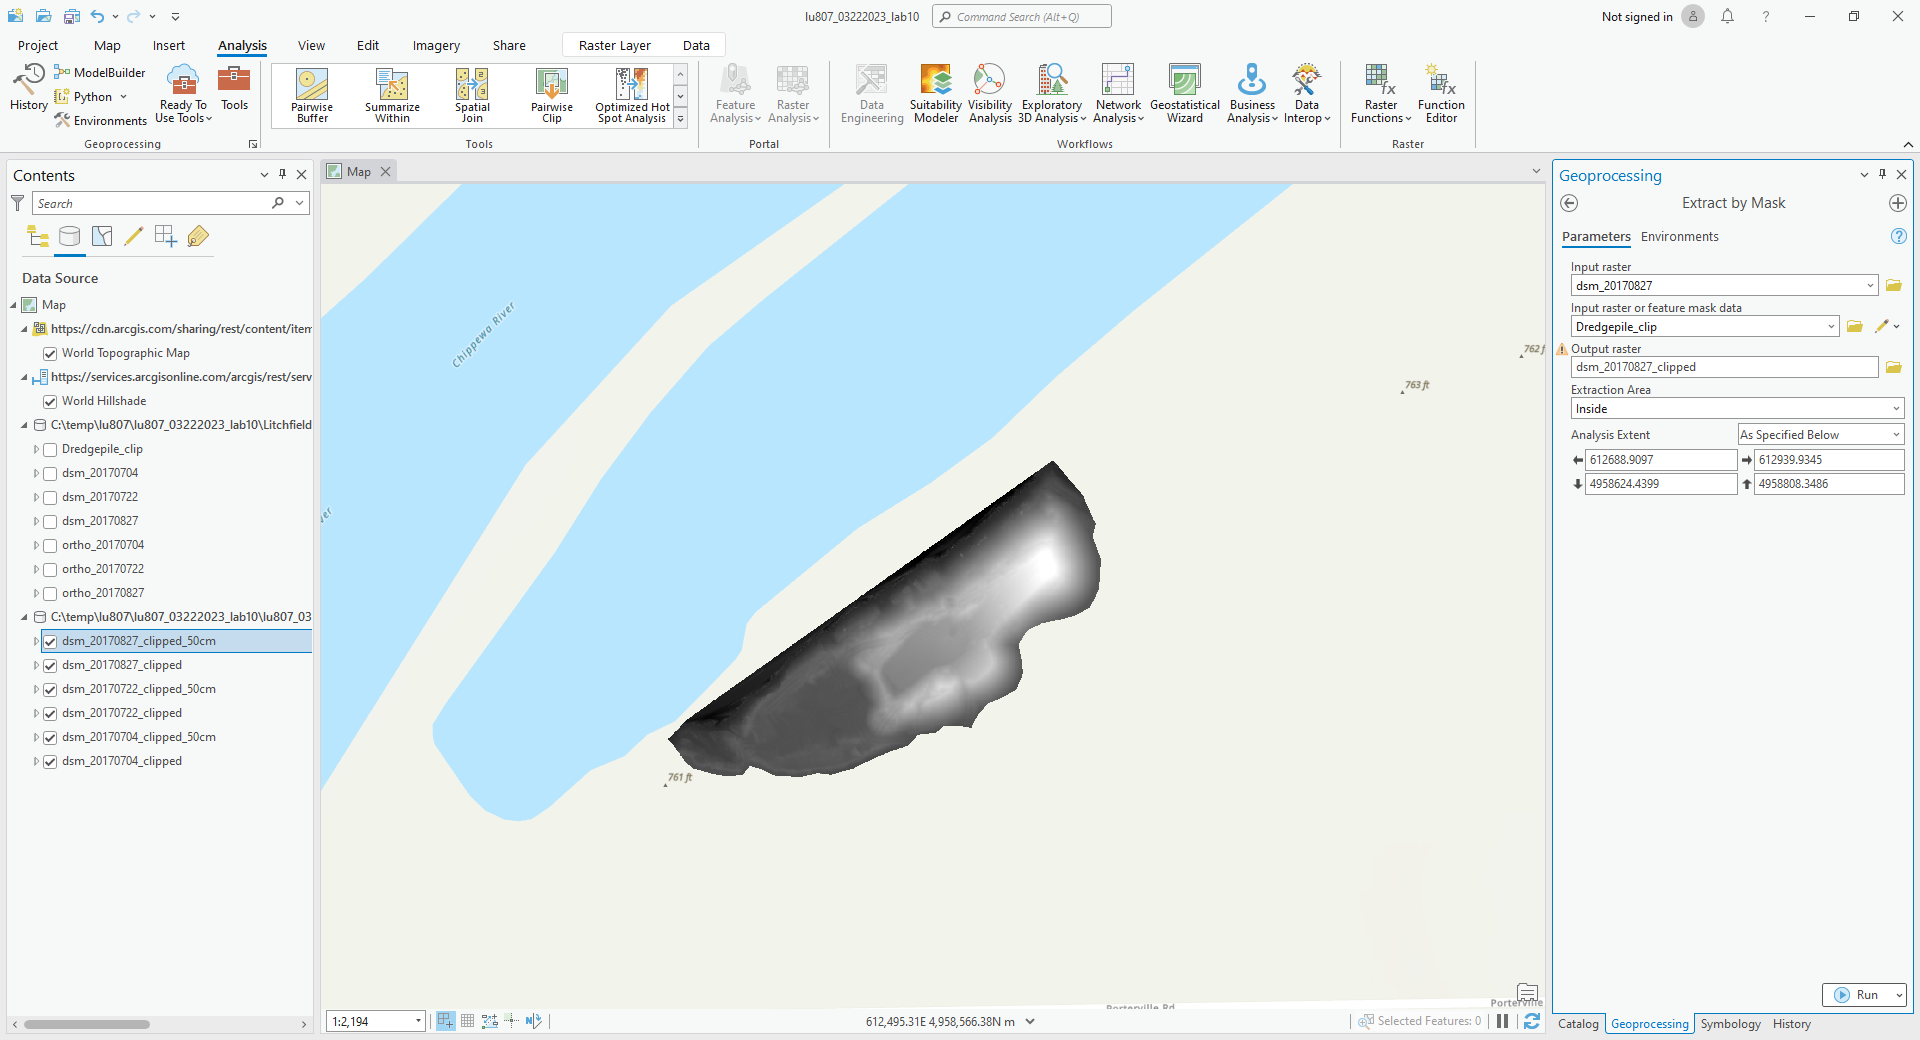
- it can change the spatial resolution of a raster dataset.
- Set input raster to the clipped DSM data for each date.
- Set X and Y cell size to 0.5 (m).
- Set resample technique to bilinear.
- Rename the output (noted with “clipped” and “50cm”).
C. Fill
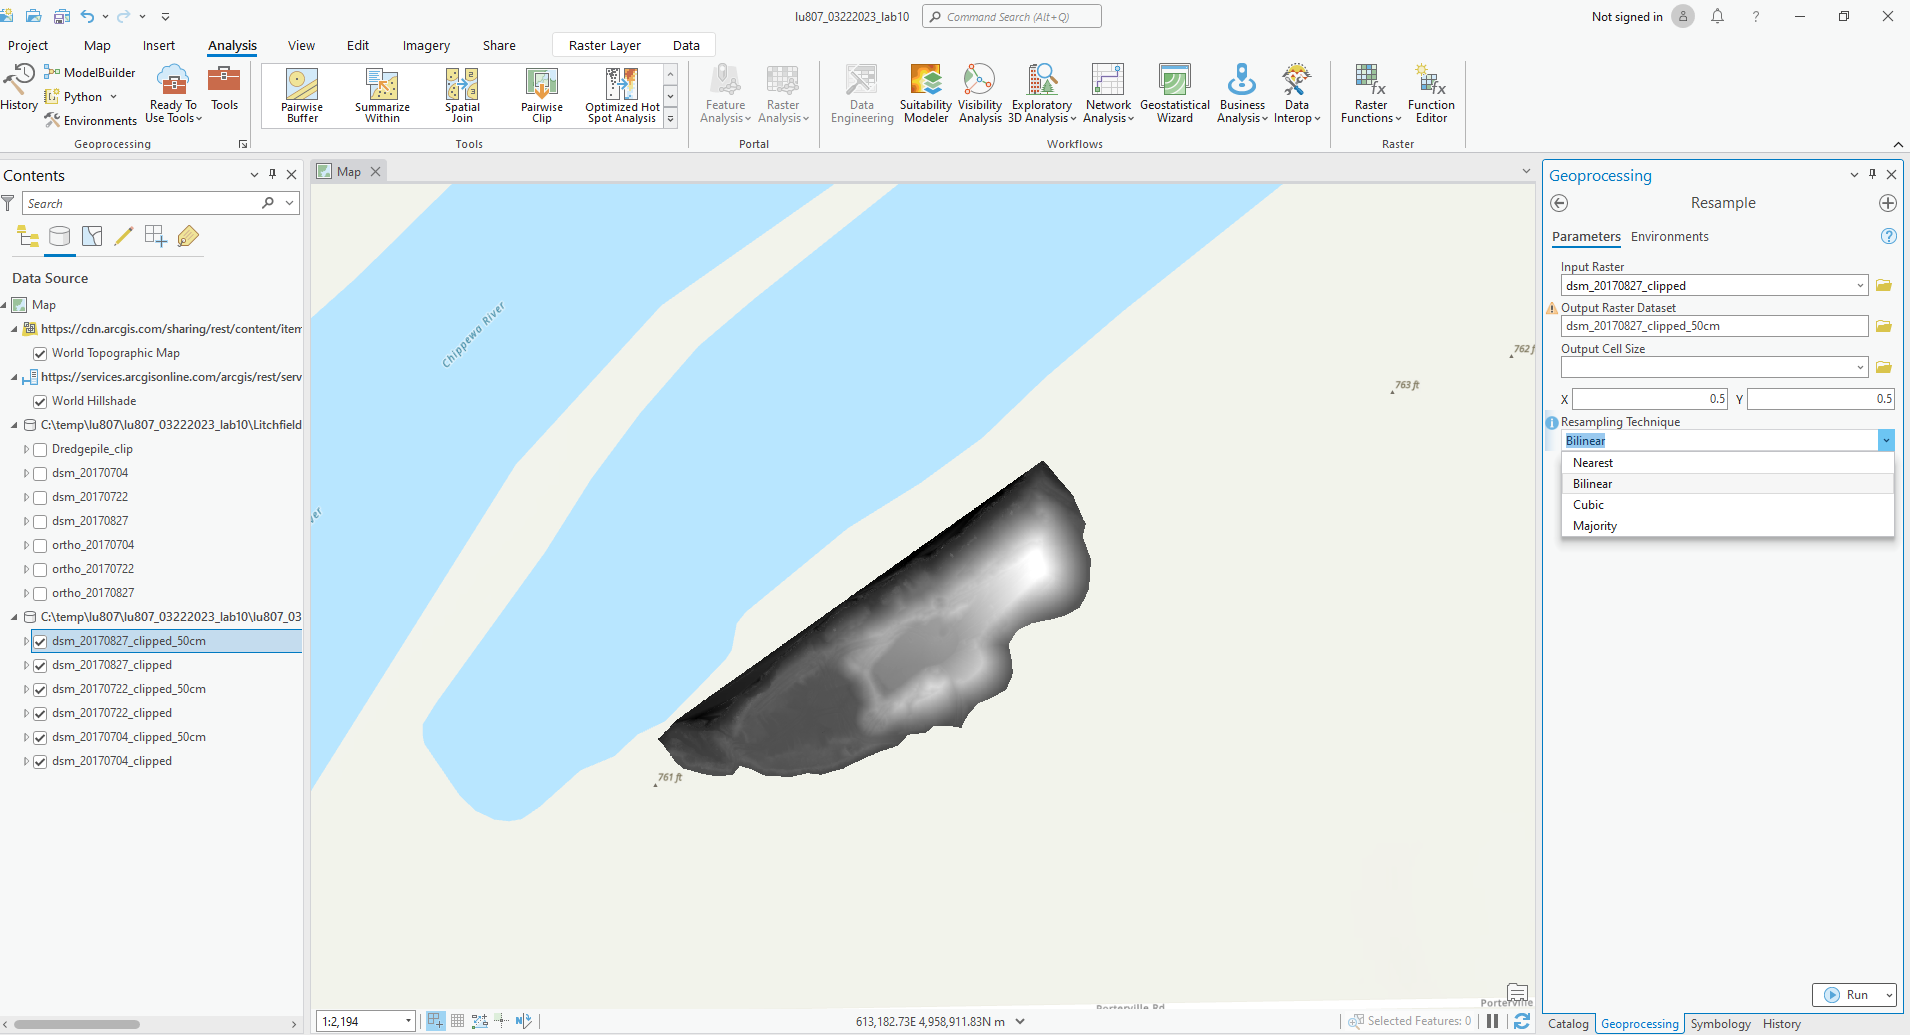
- It fills the sinks to remove small imperfections.
- Set input raster to the clipped 50cm DSM data for each date.
- Set Z limit to 0.25
- Rename the output (noted with “fill” and “25cm”).
III. Starting Analysis
The questions that the client wanted to figure out are listed:
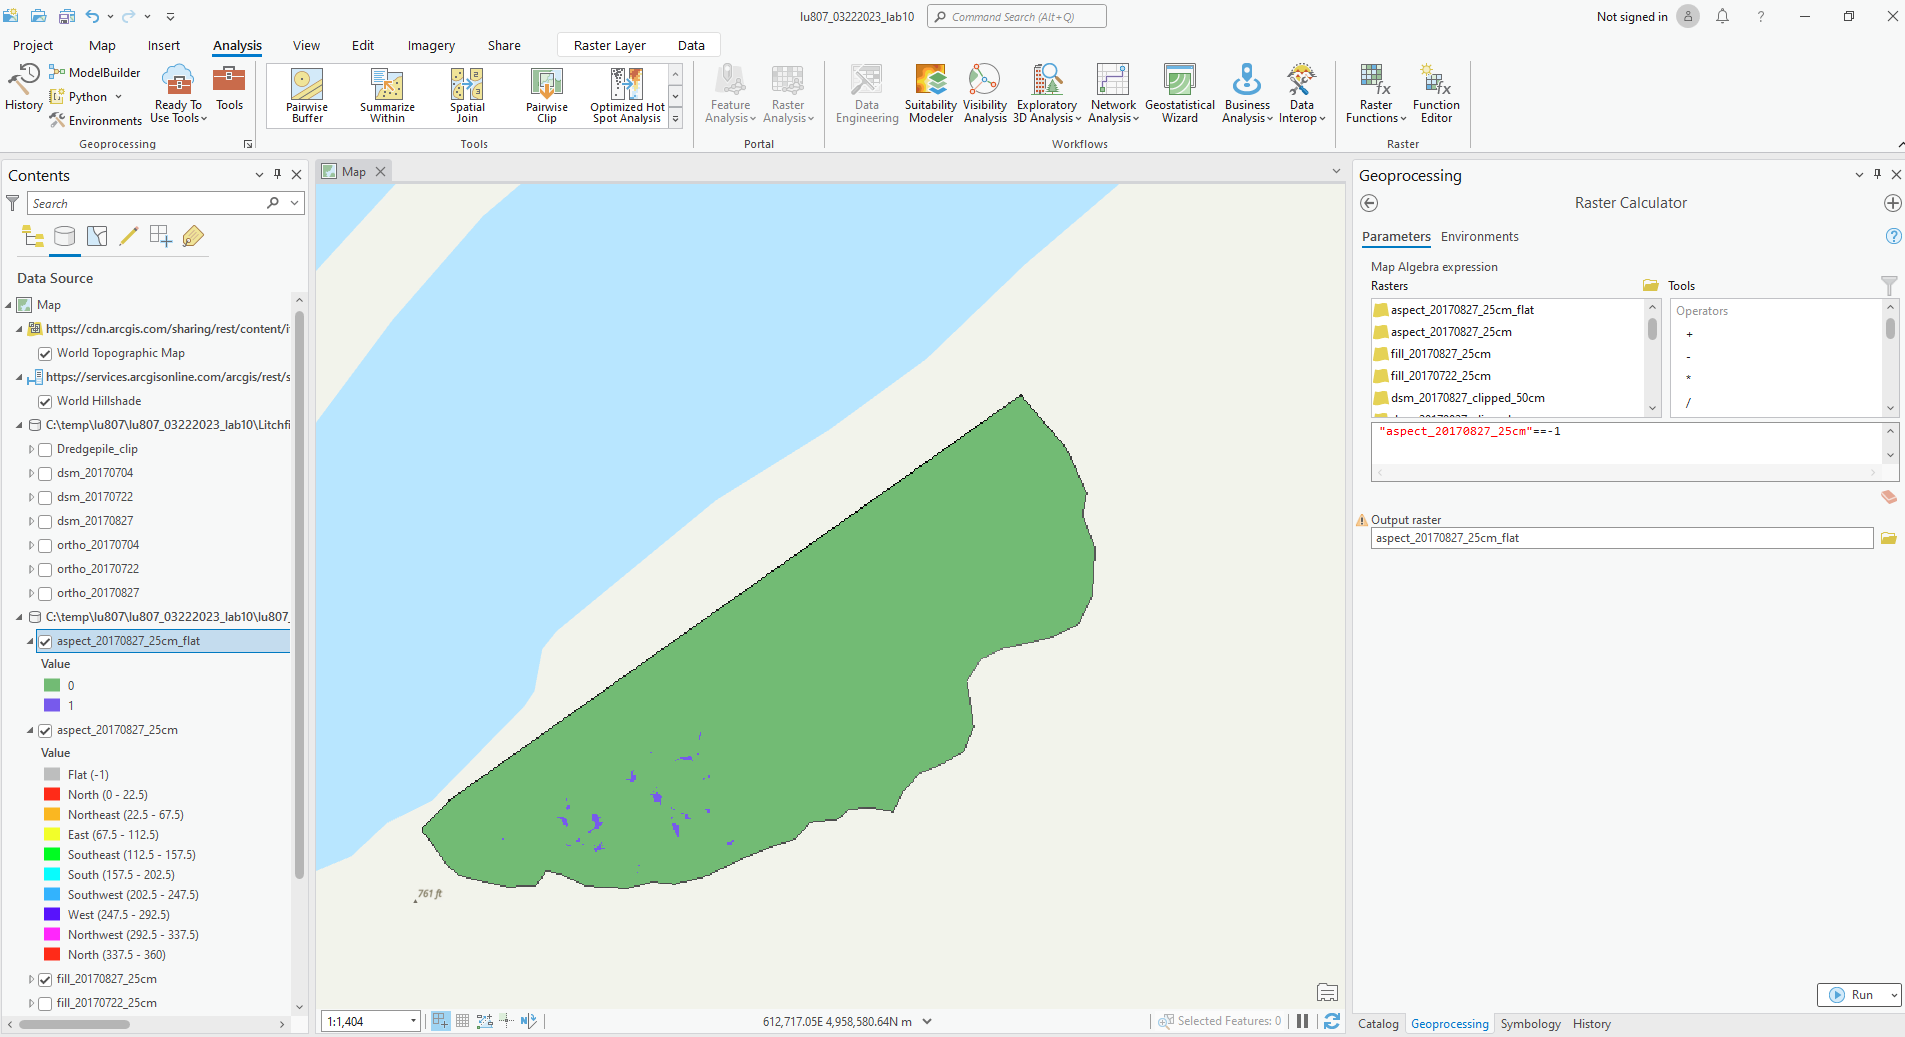
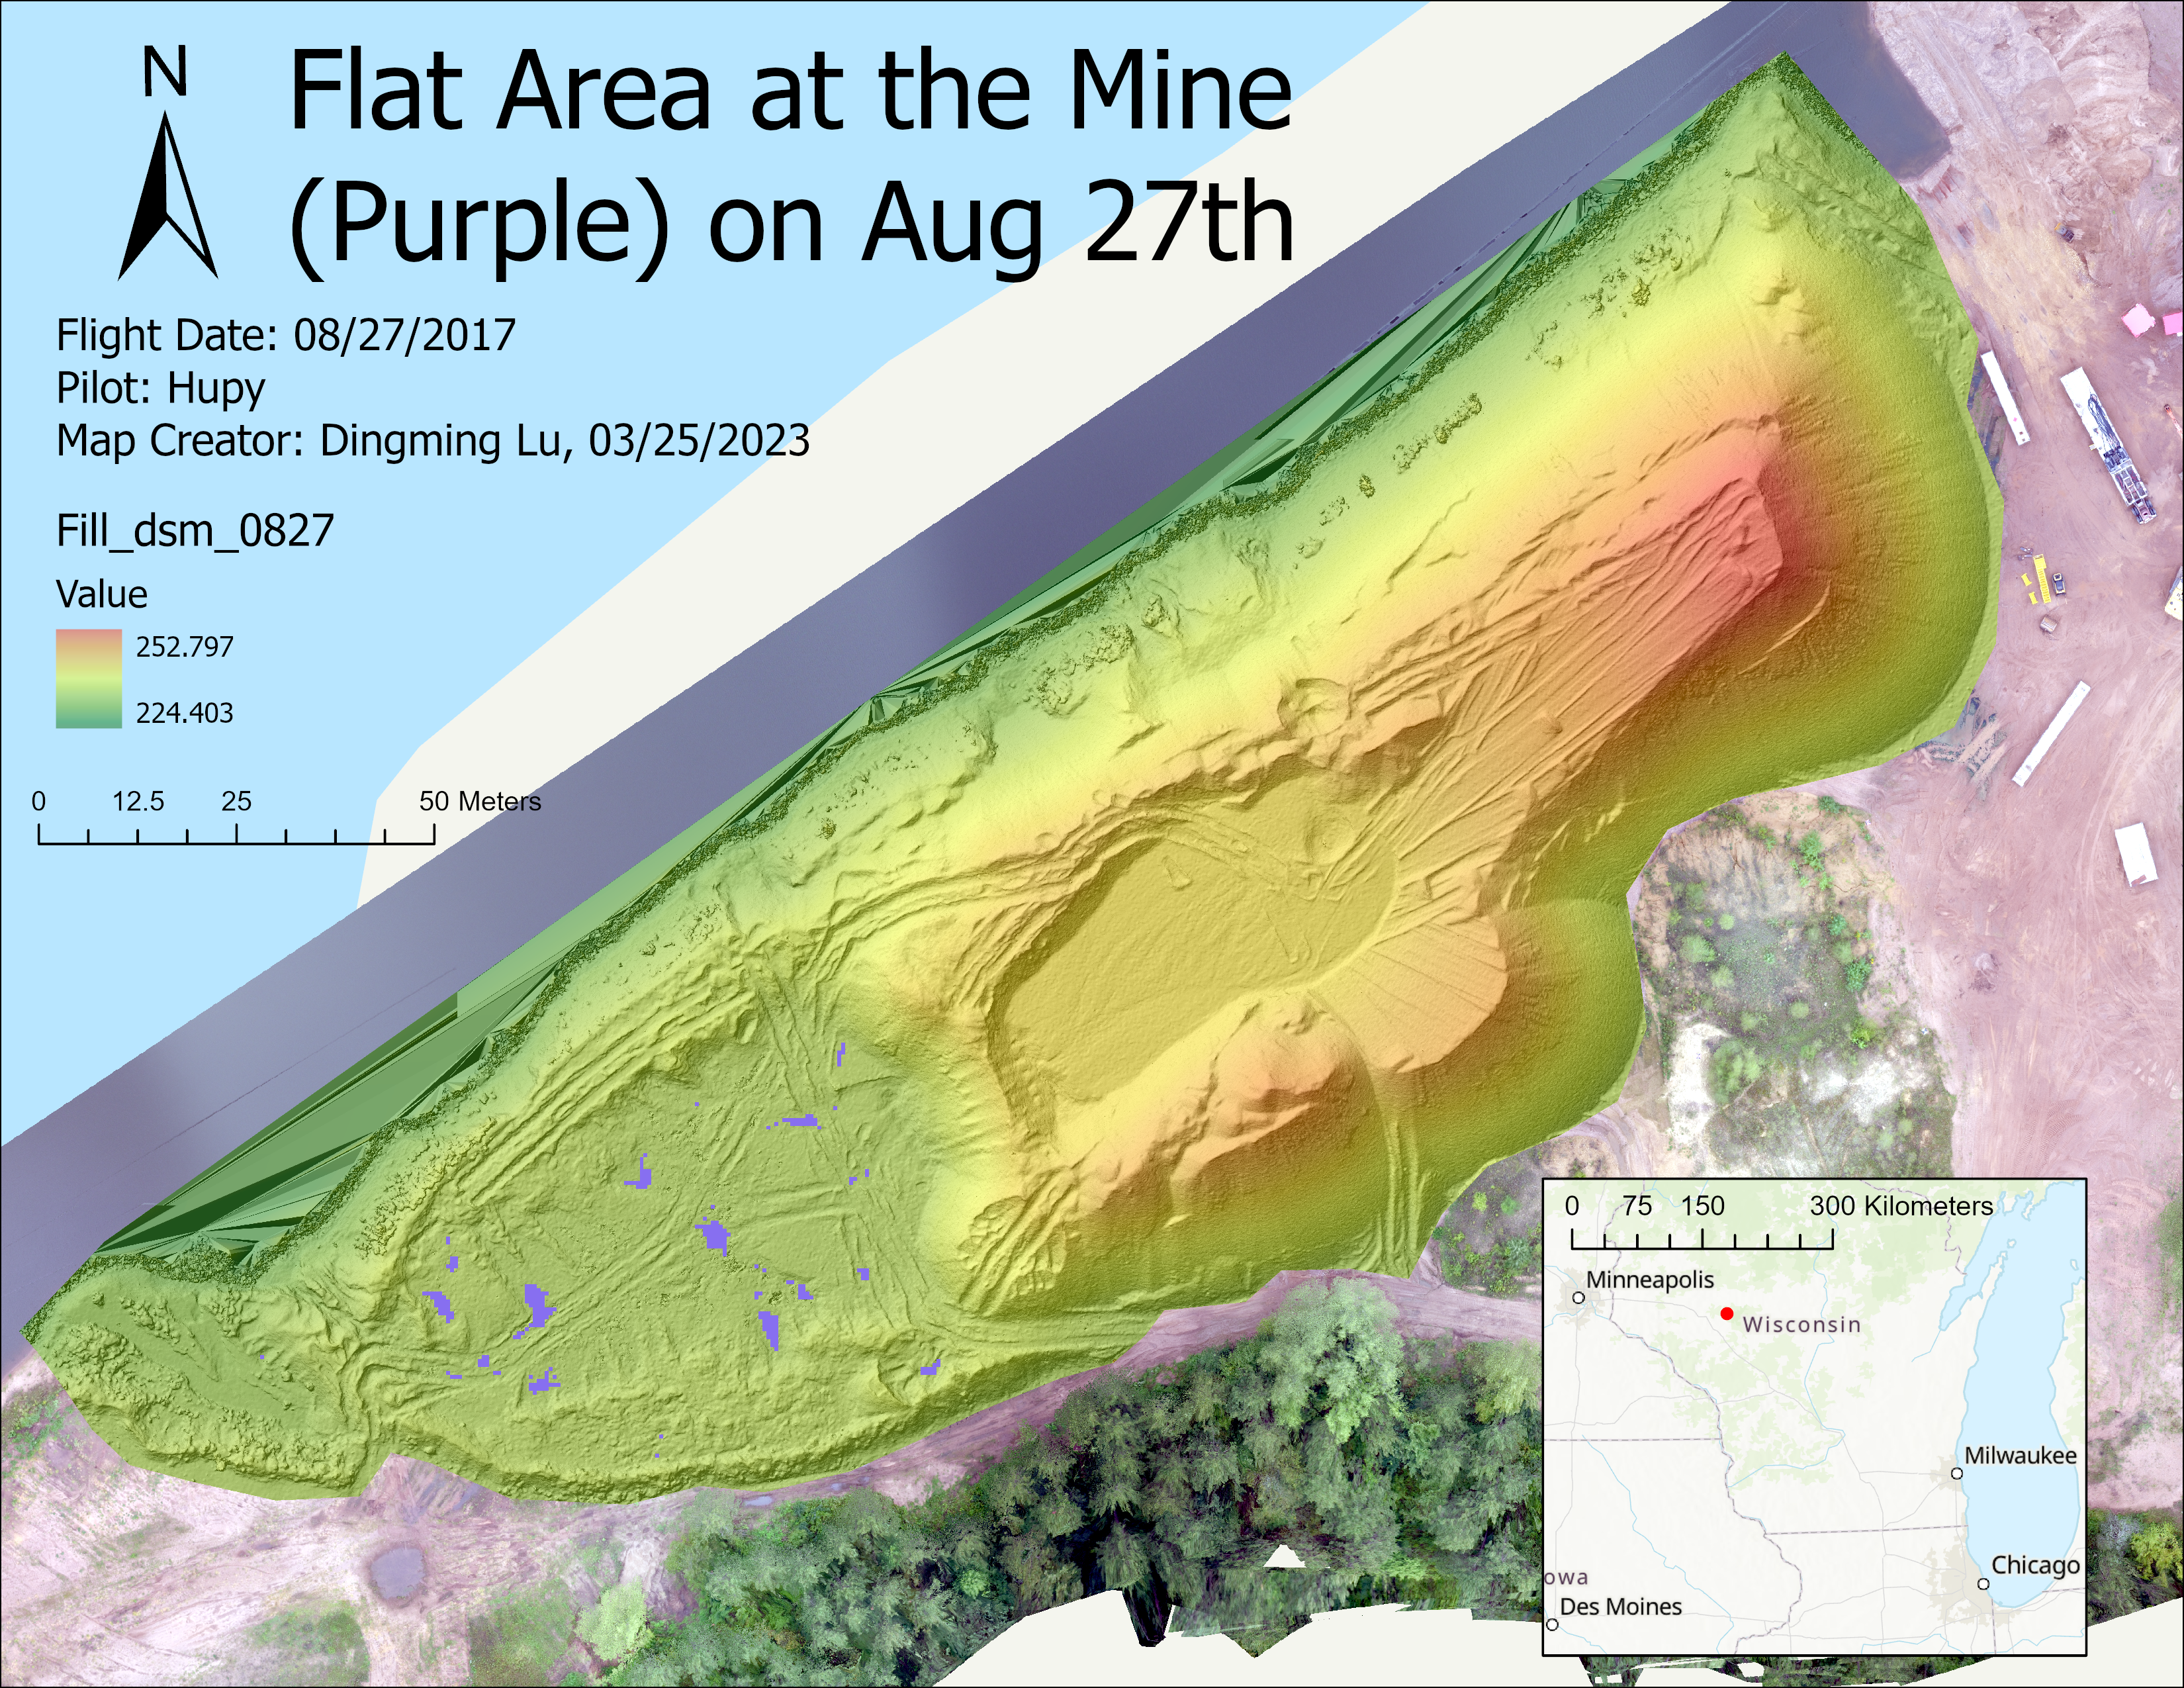
- Where are the flat areas on 0827?
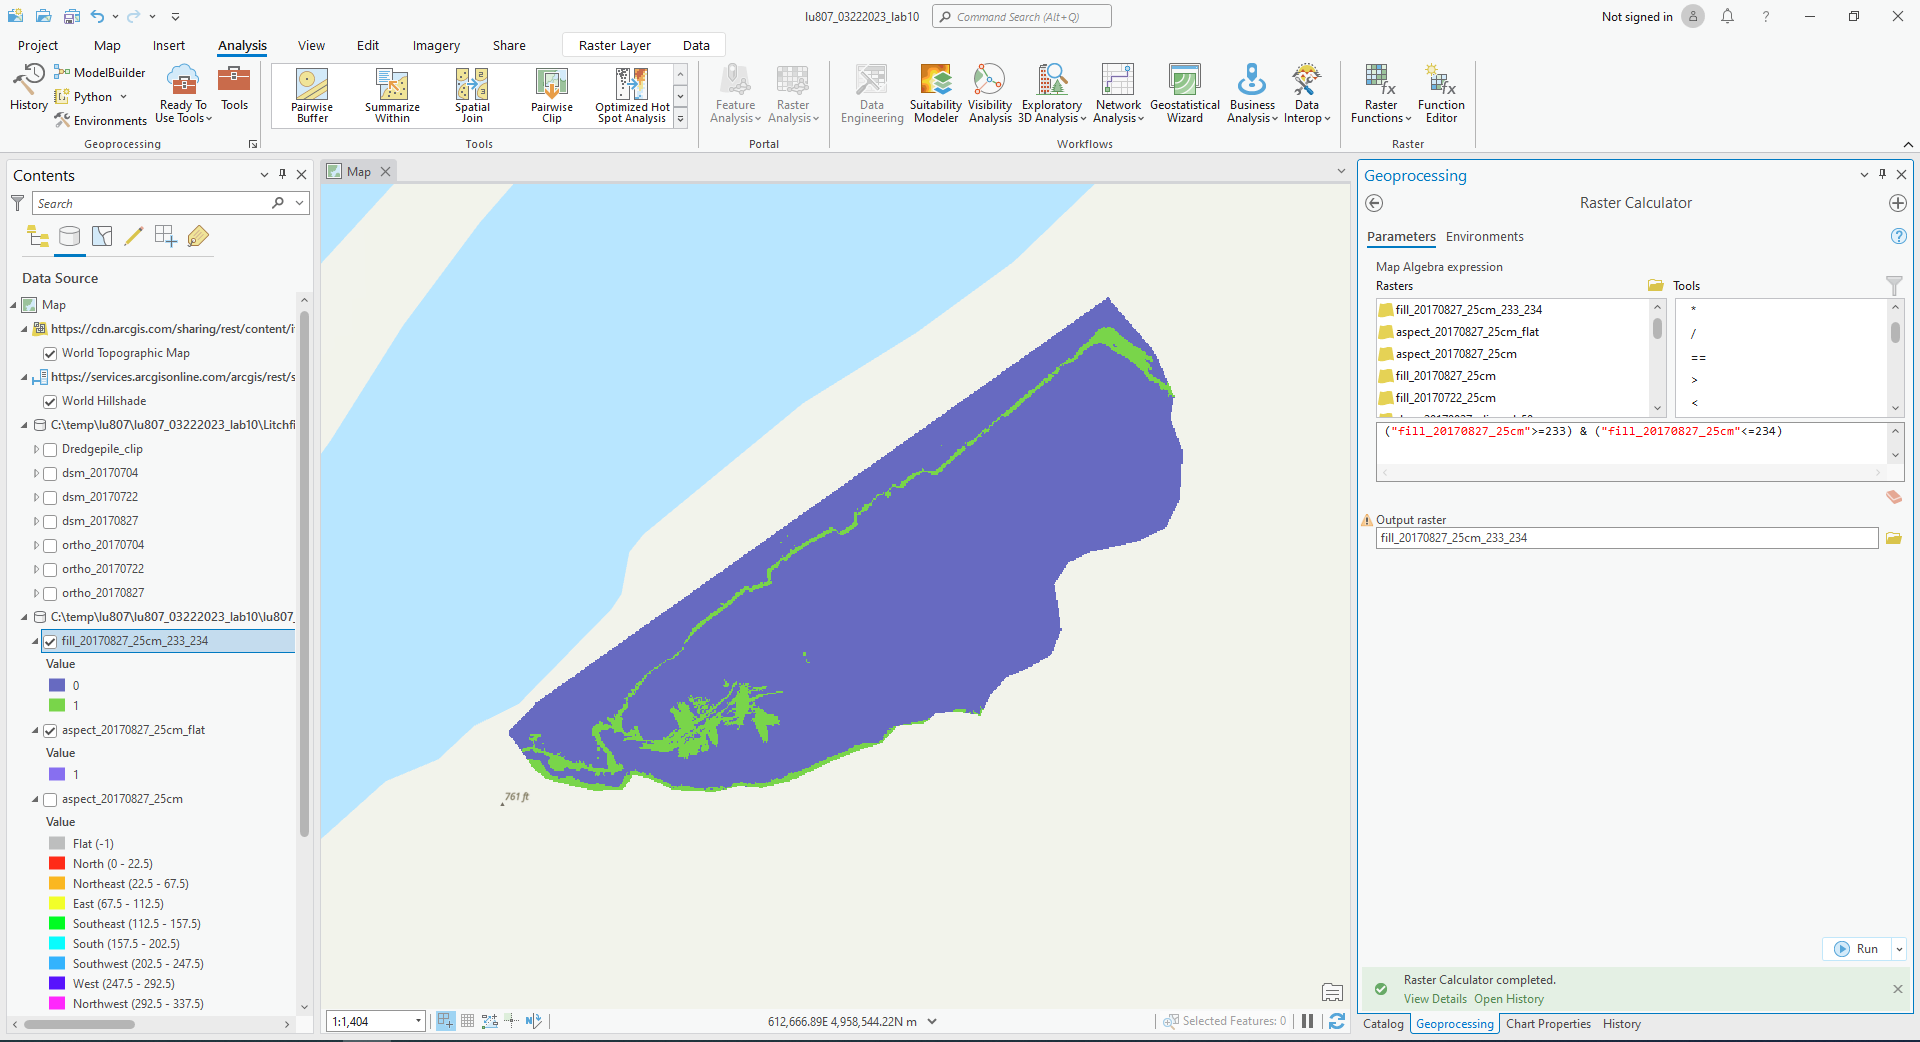
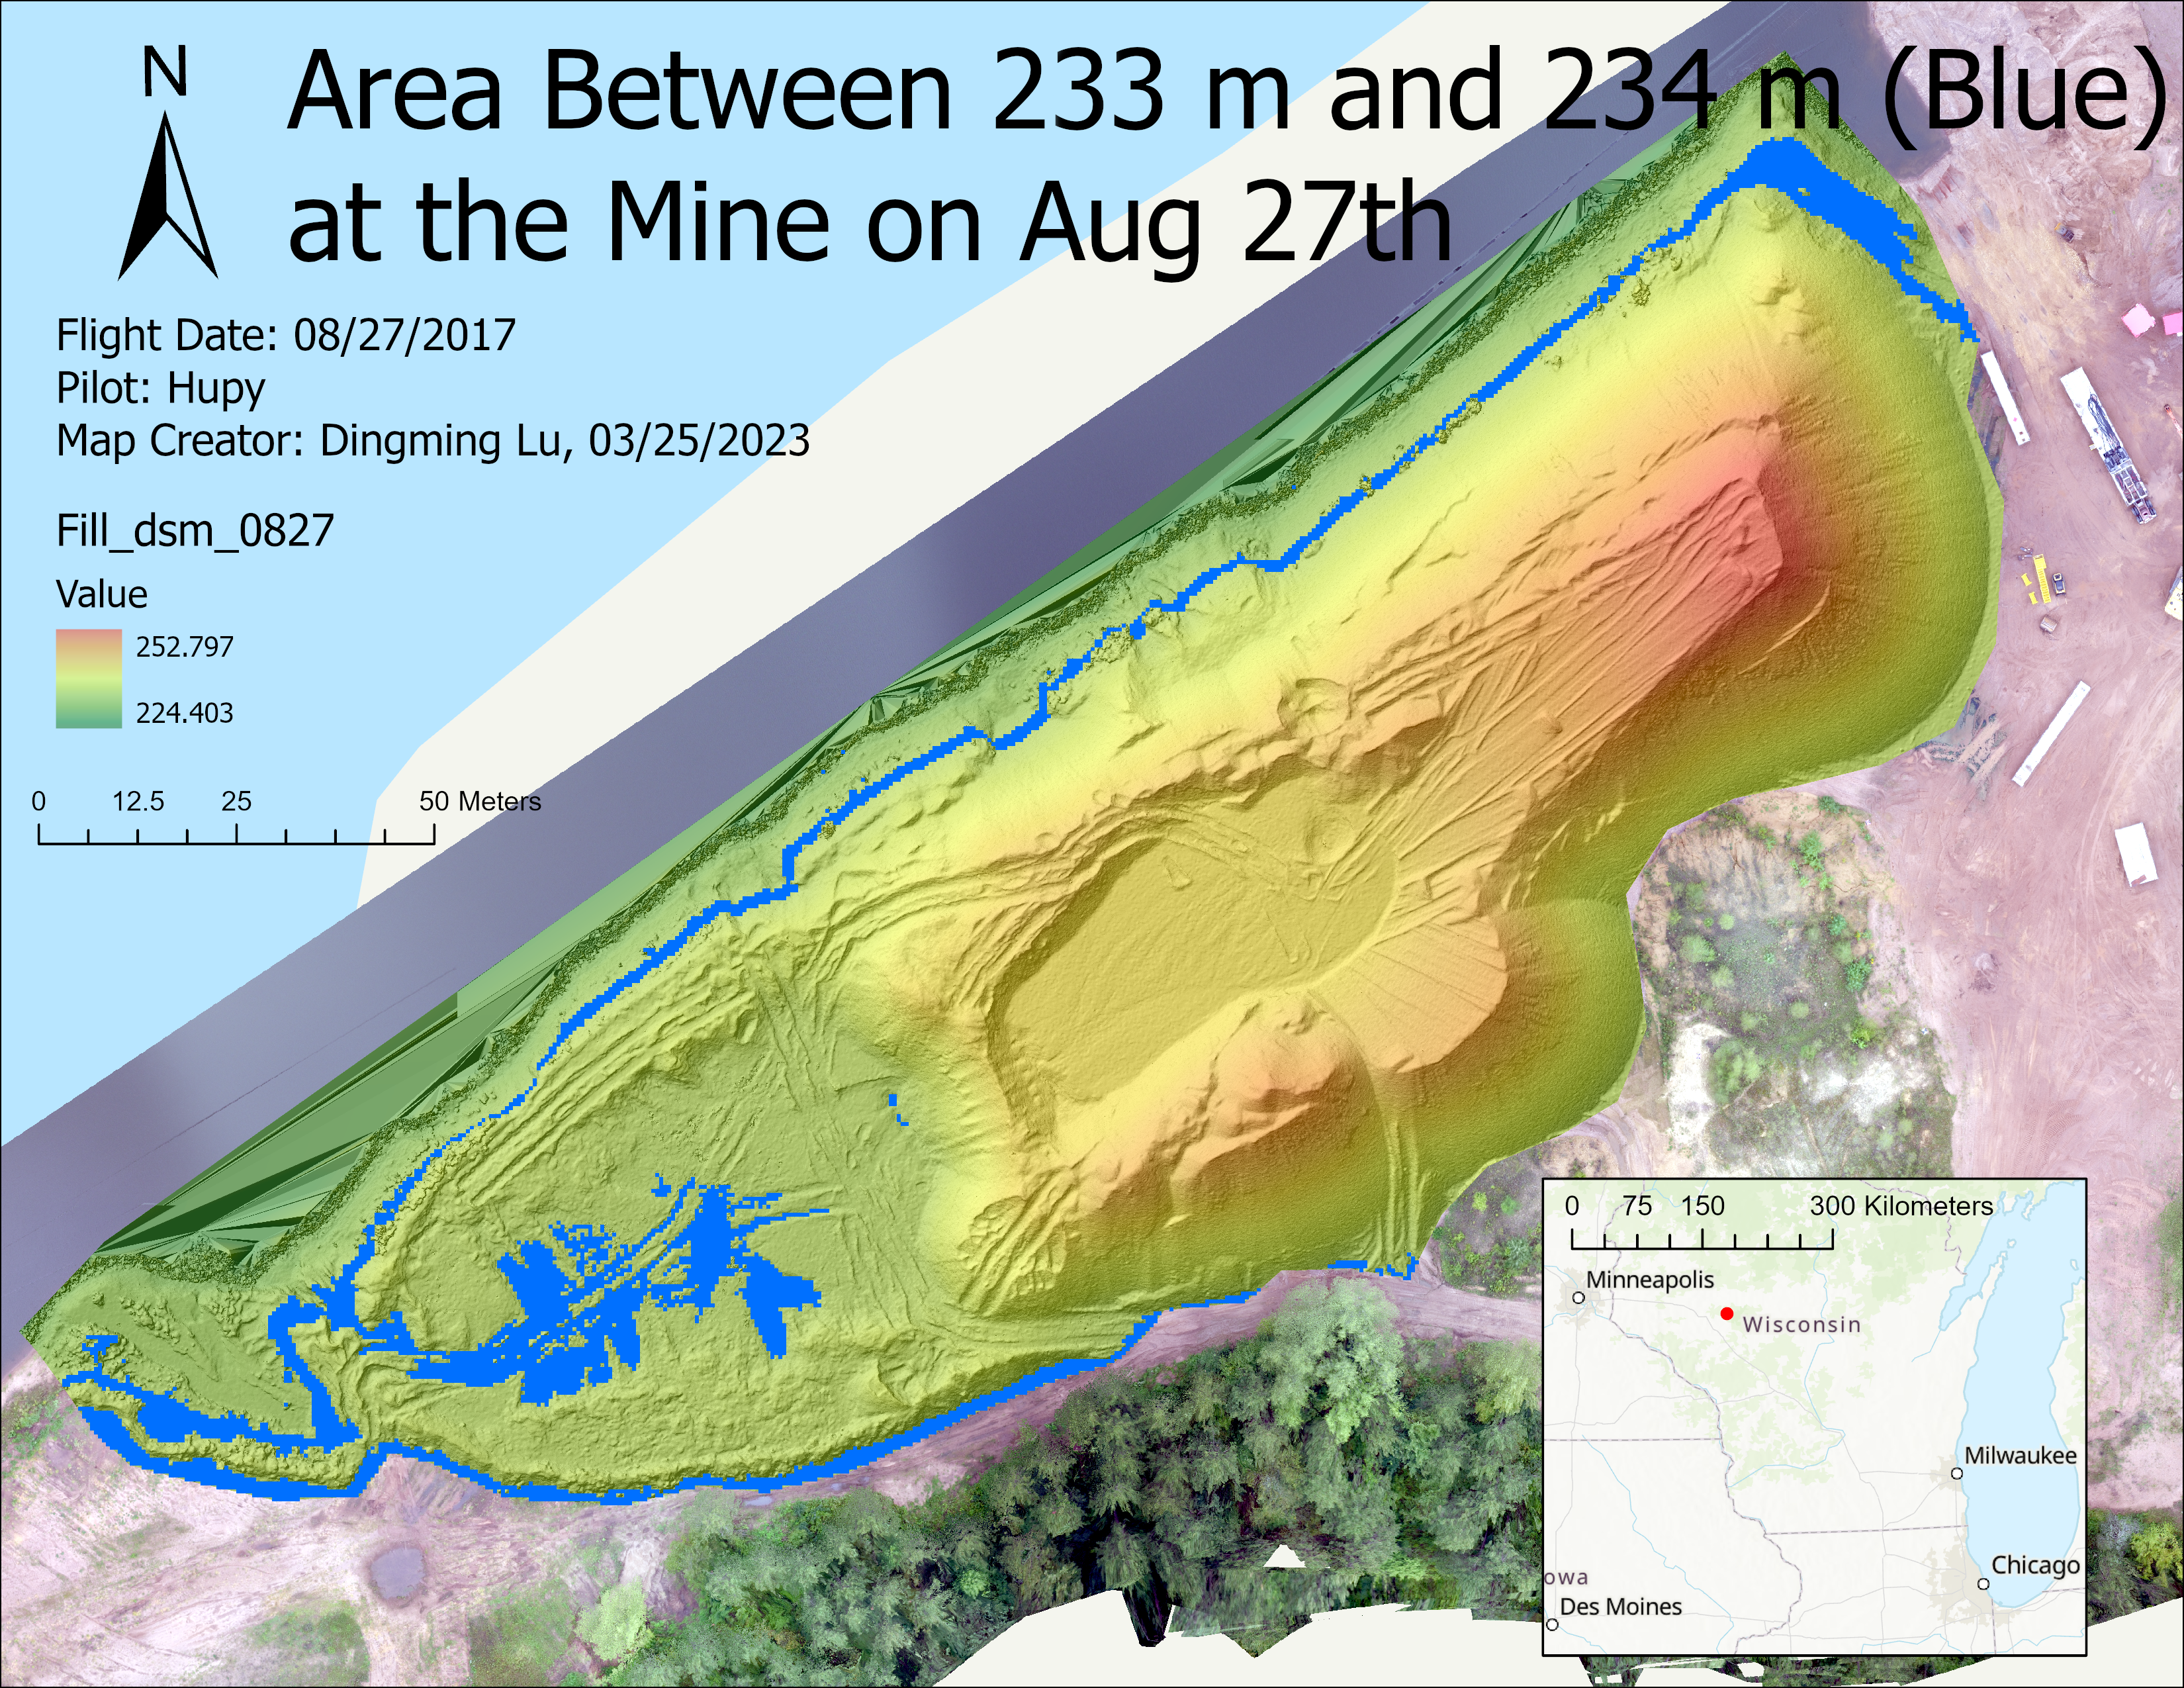
- Find all areas between 233 m and 234 m on 0827.
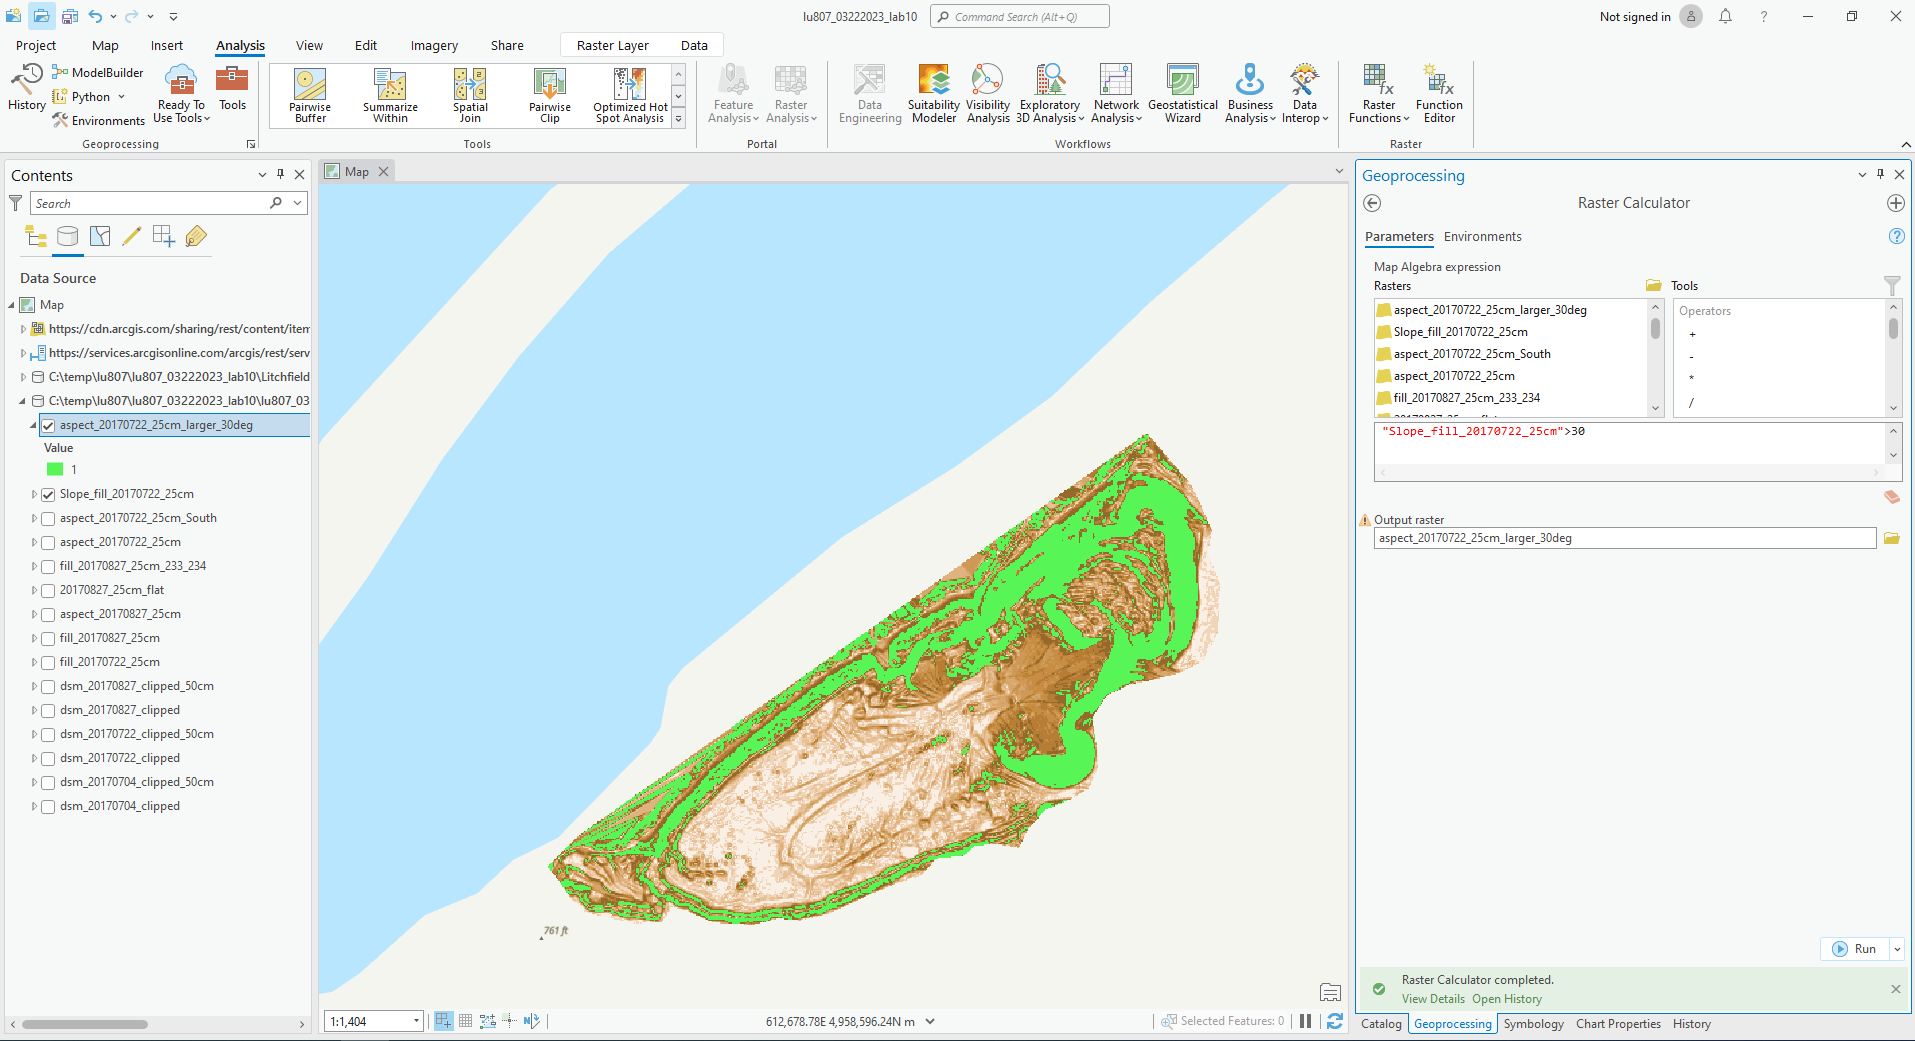
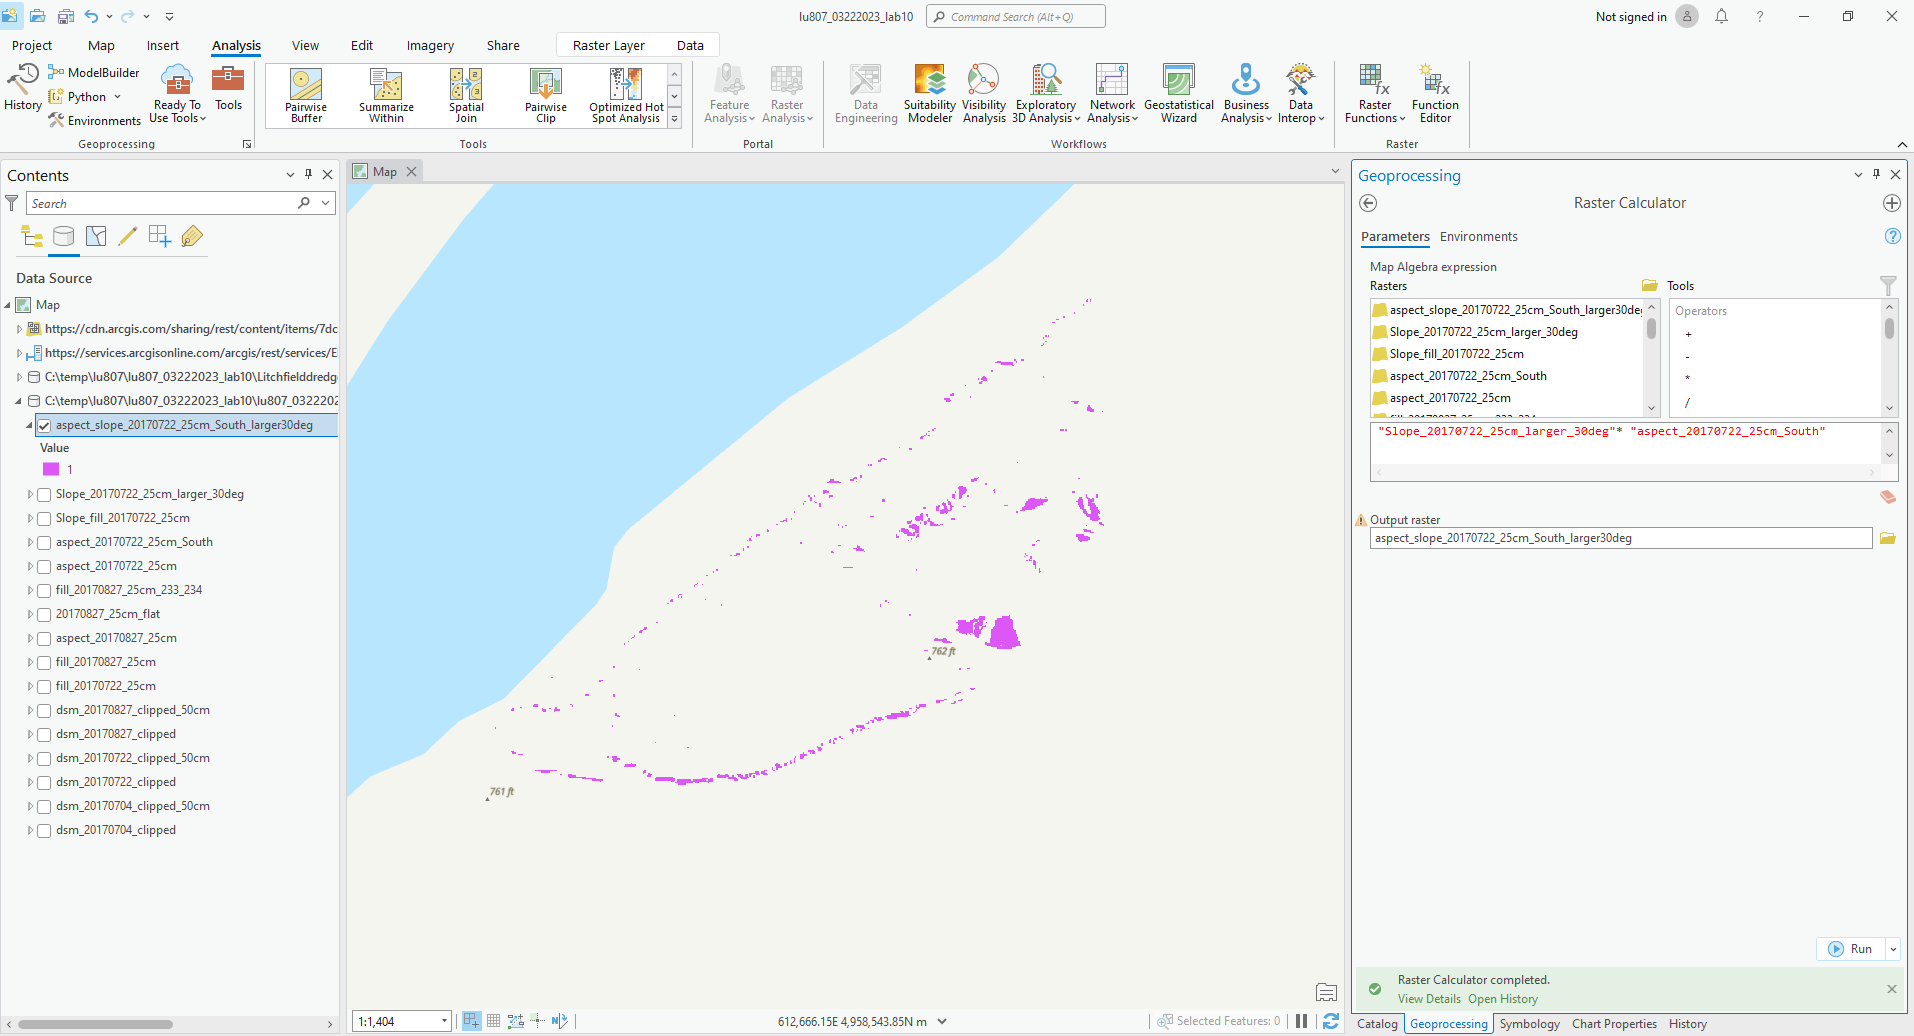
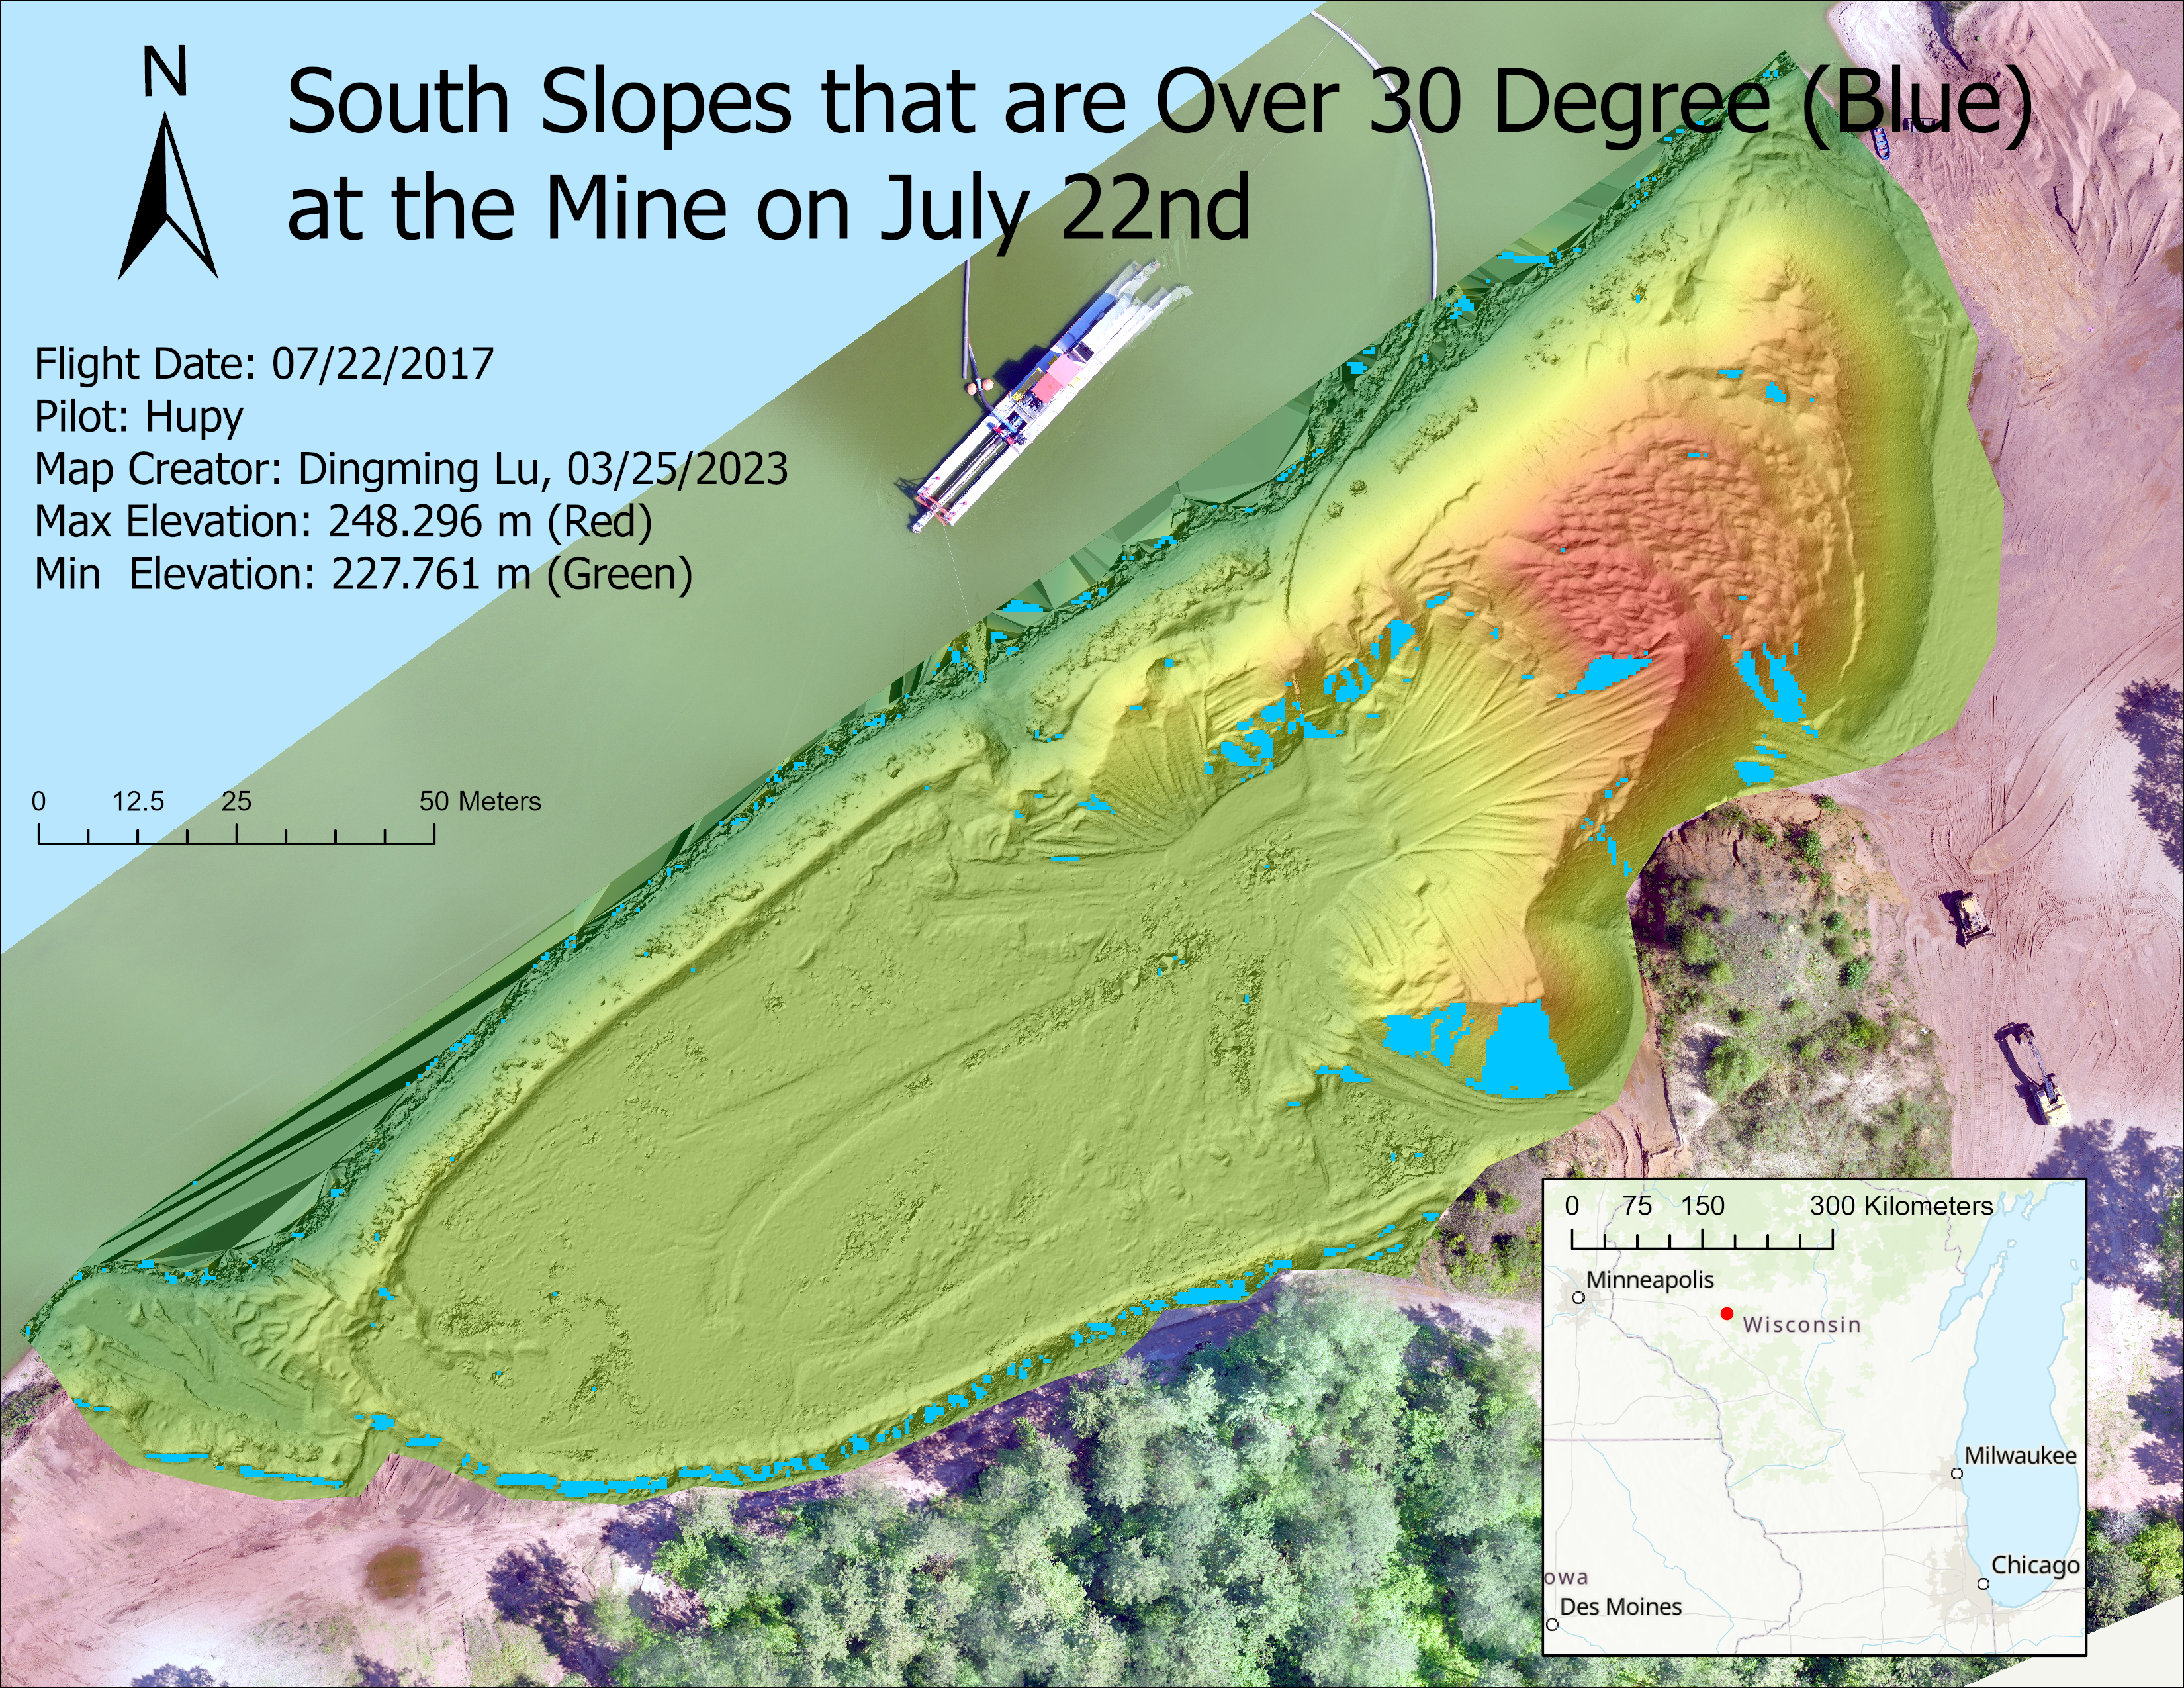
- Find out all slopes that are facing south and over 30 degrees on 0722 (unsafe).
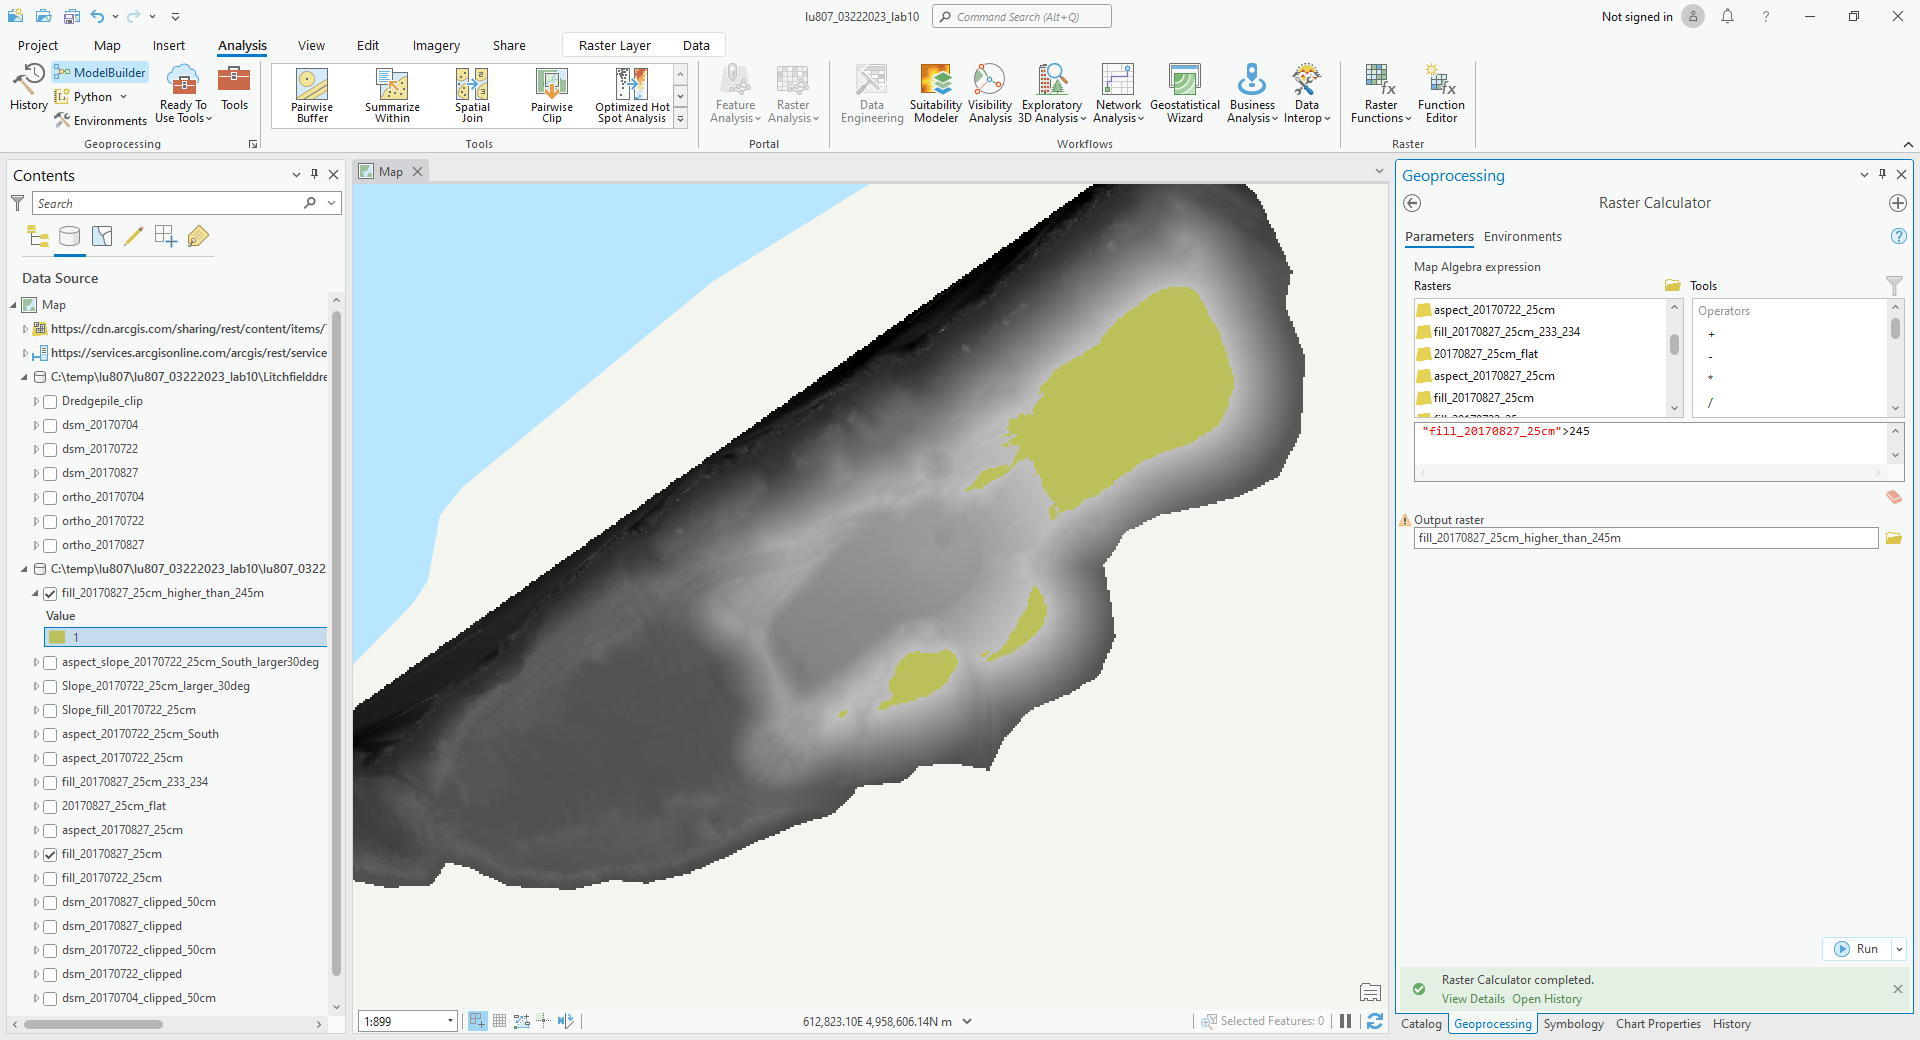
- Find out where the pile is over 245 m on 0827.
- In the area over 245 m, find the slops that is over 30 degrees.
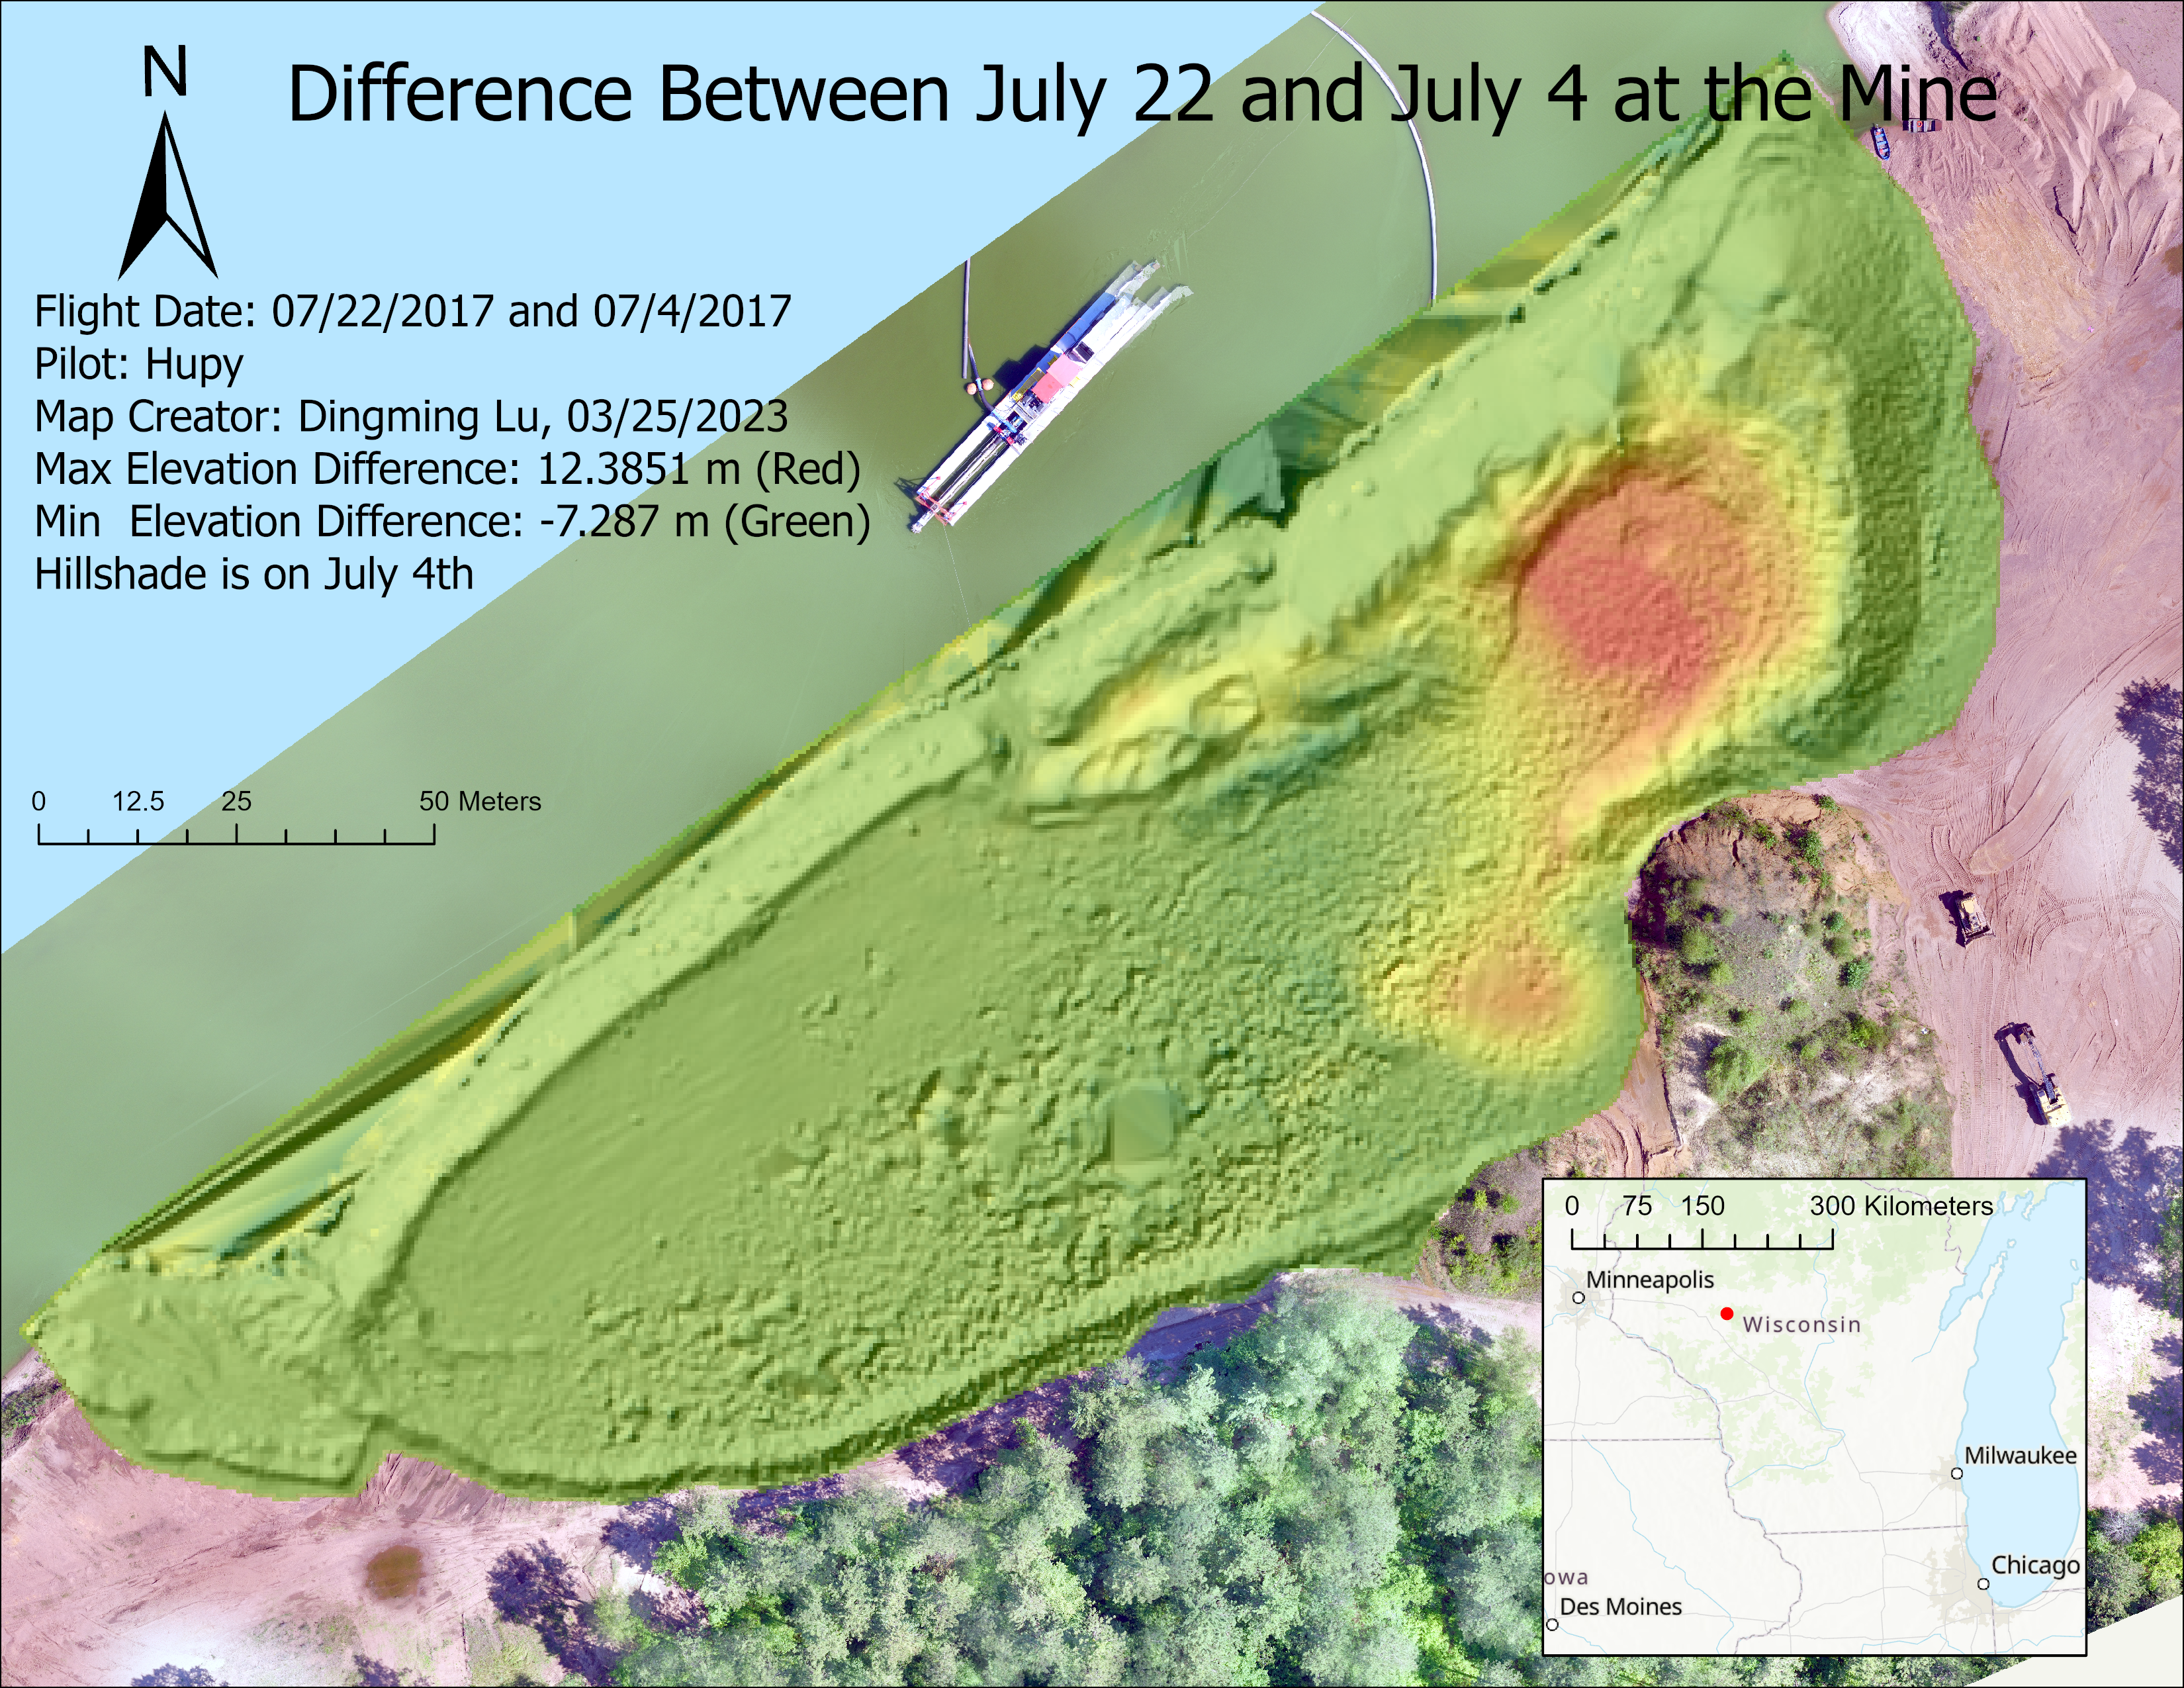
- Find the difference between 0722 and 0704.
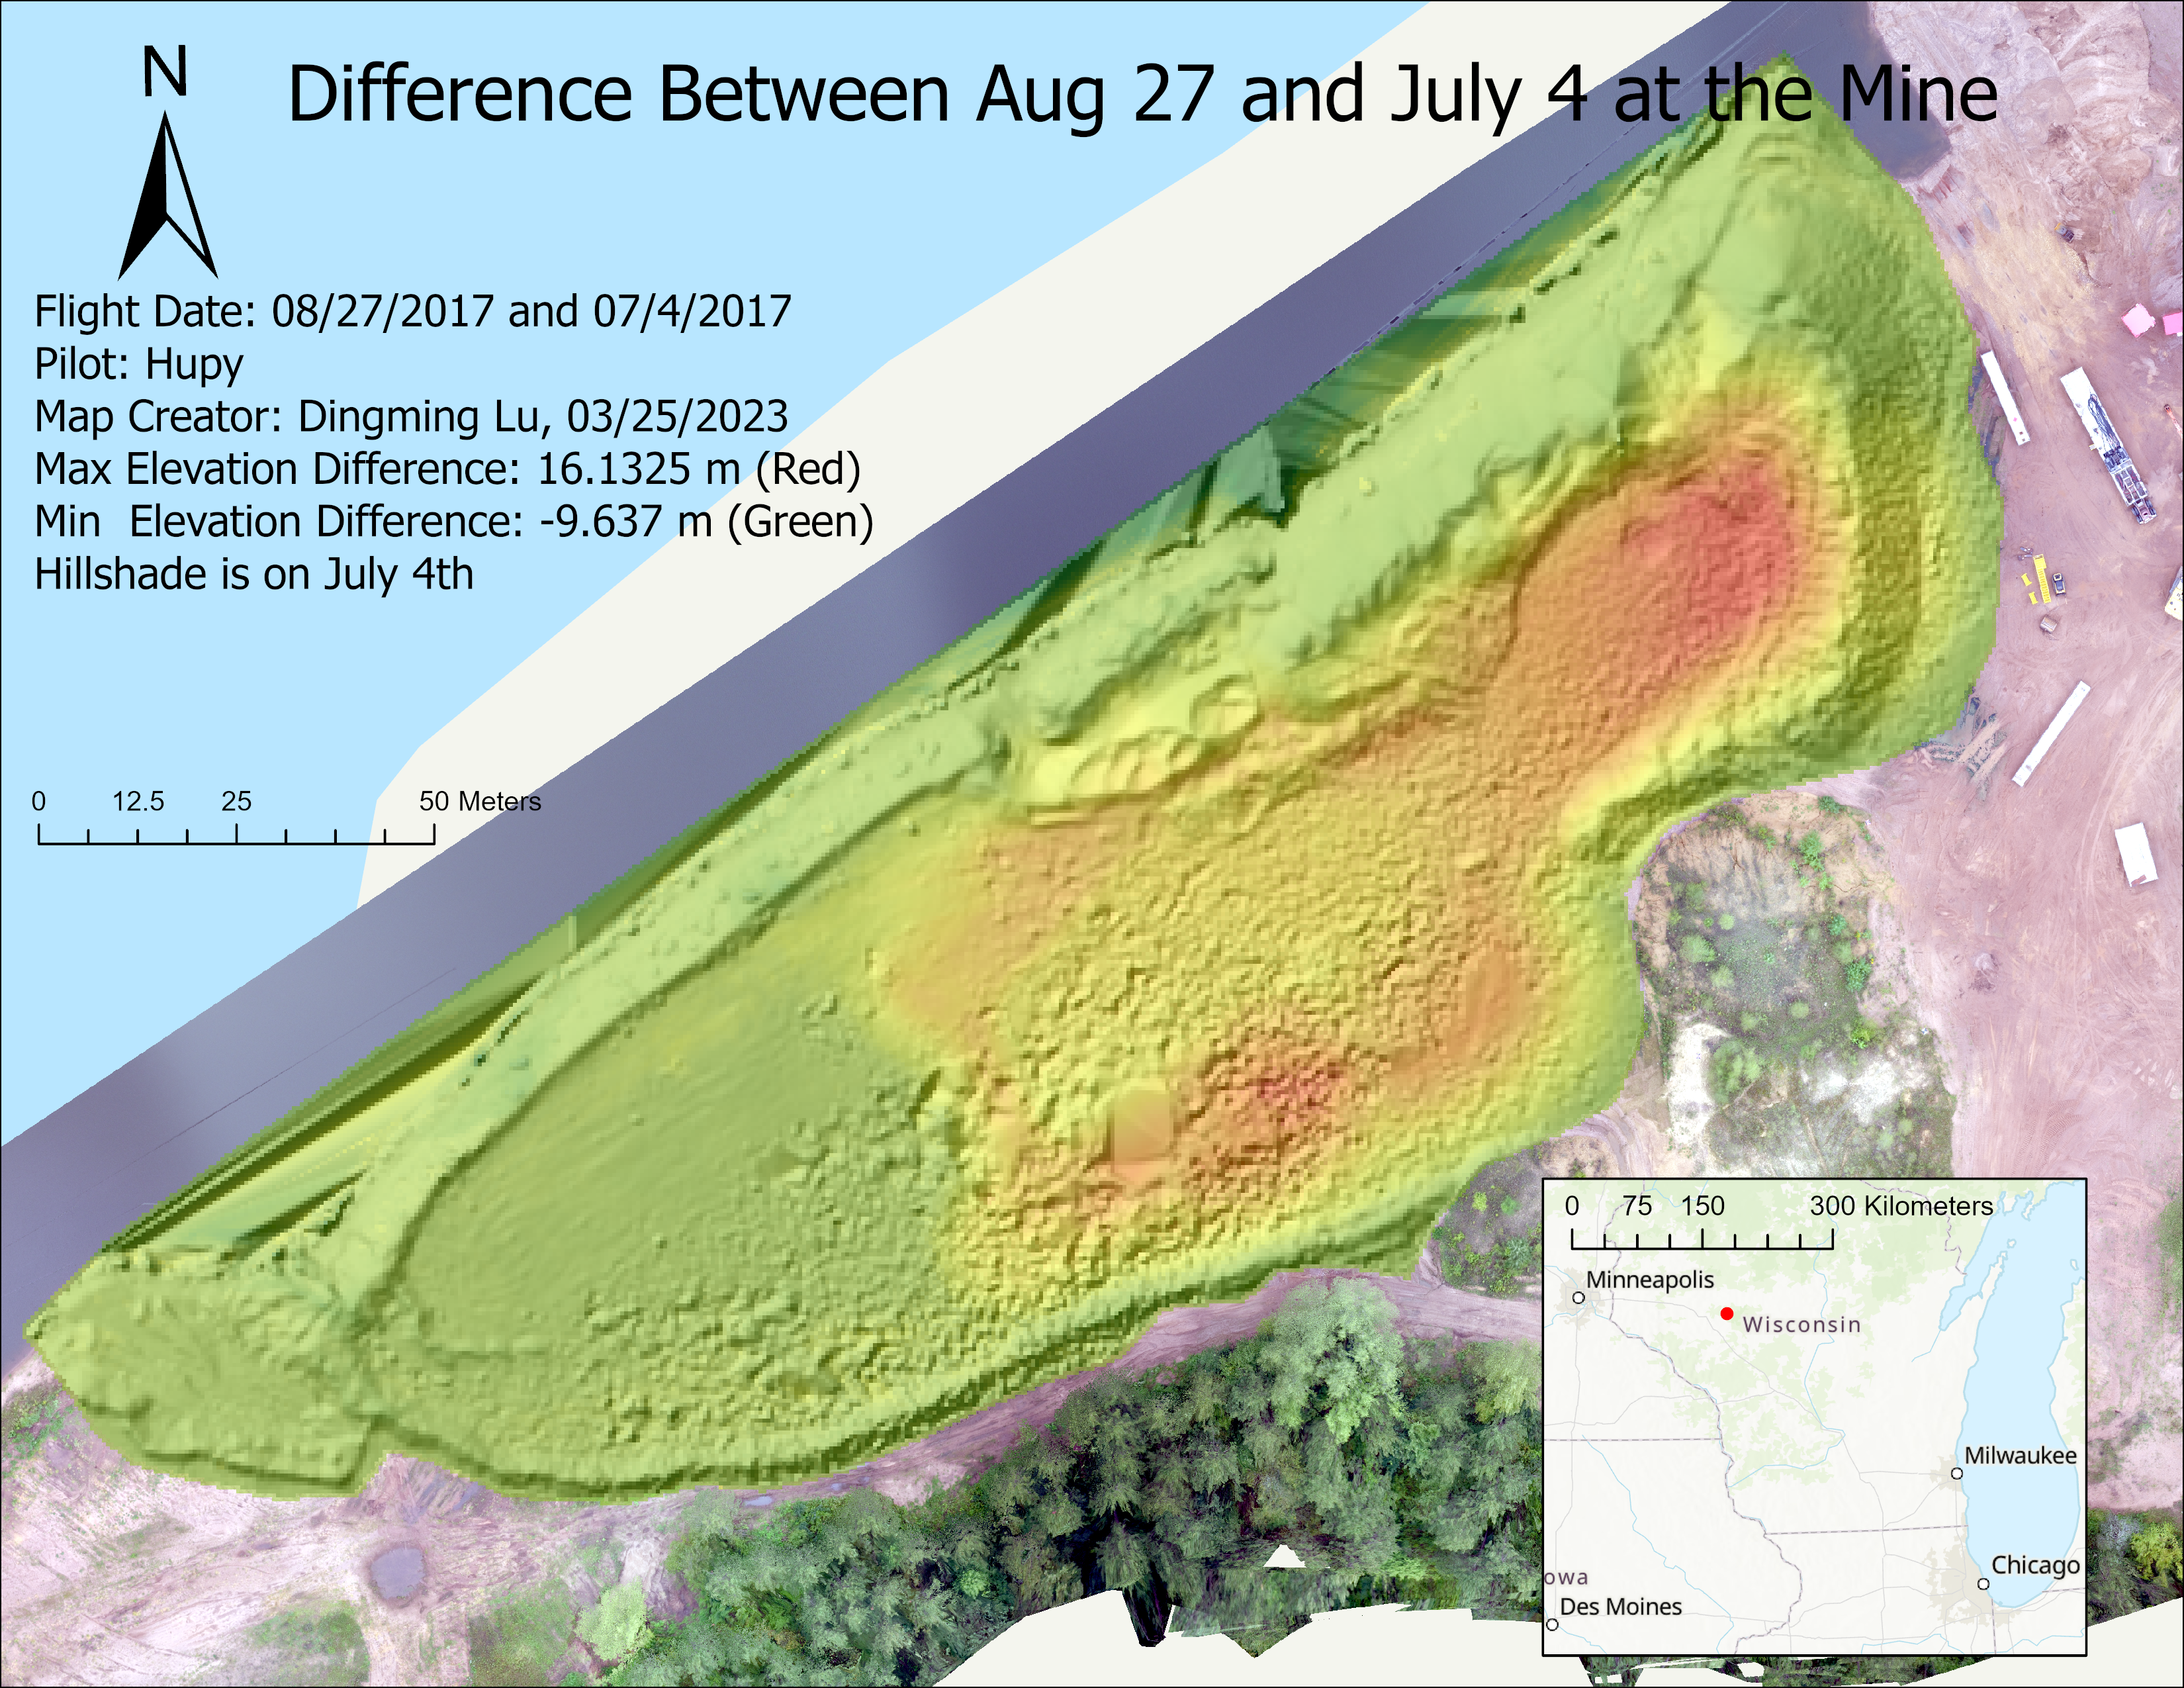
- Find the difference between 0827 and 0704.
- Find the difference between 0827 and 0722.
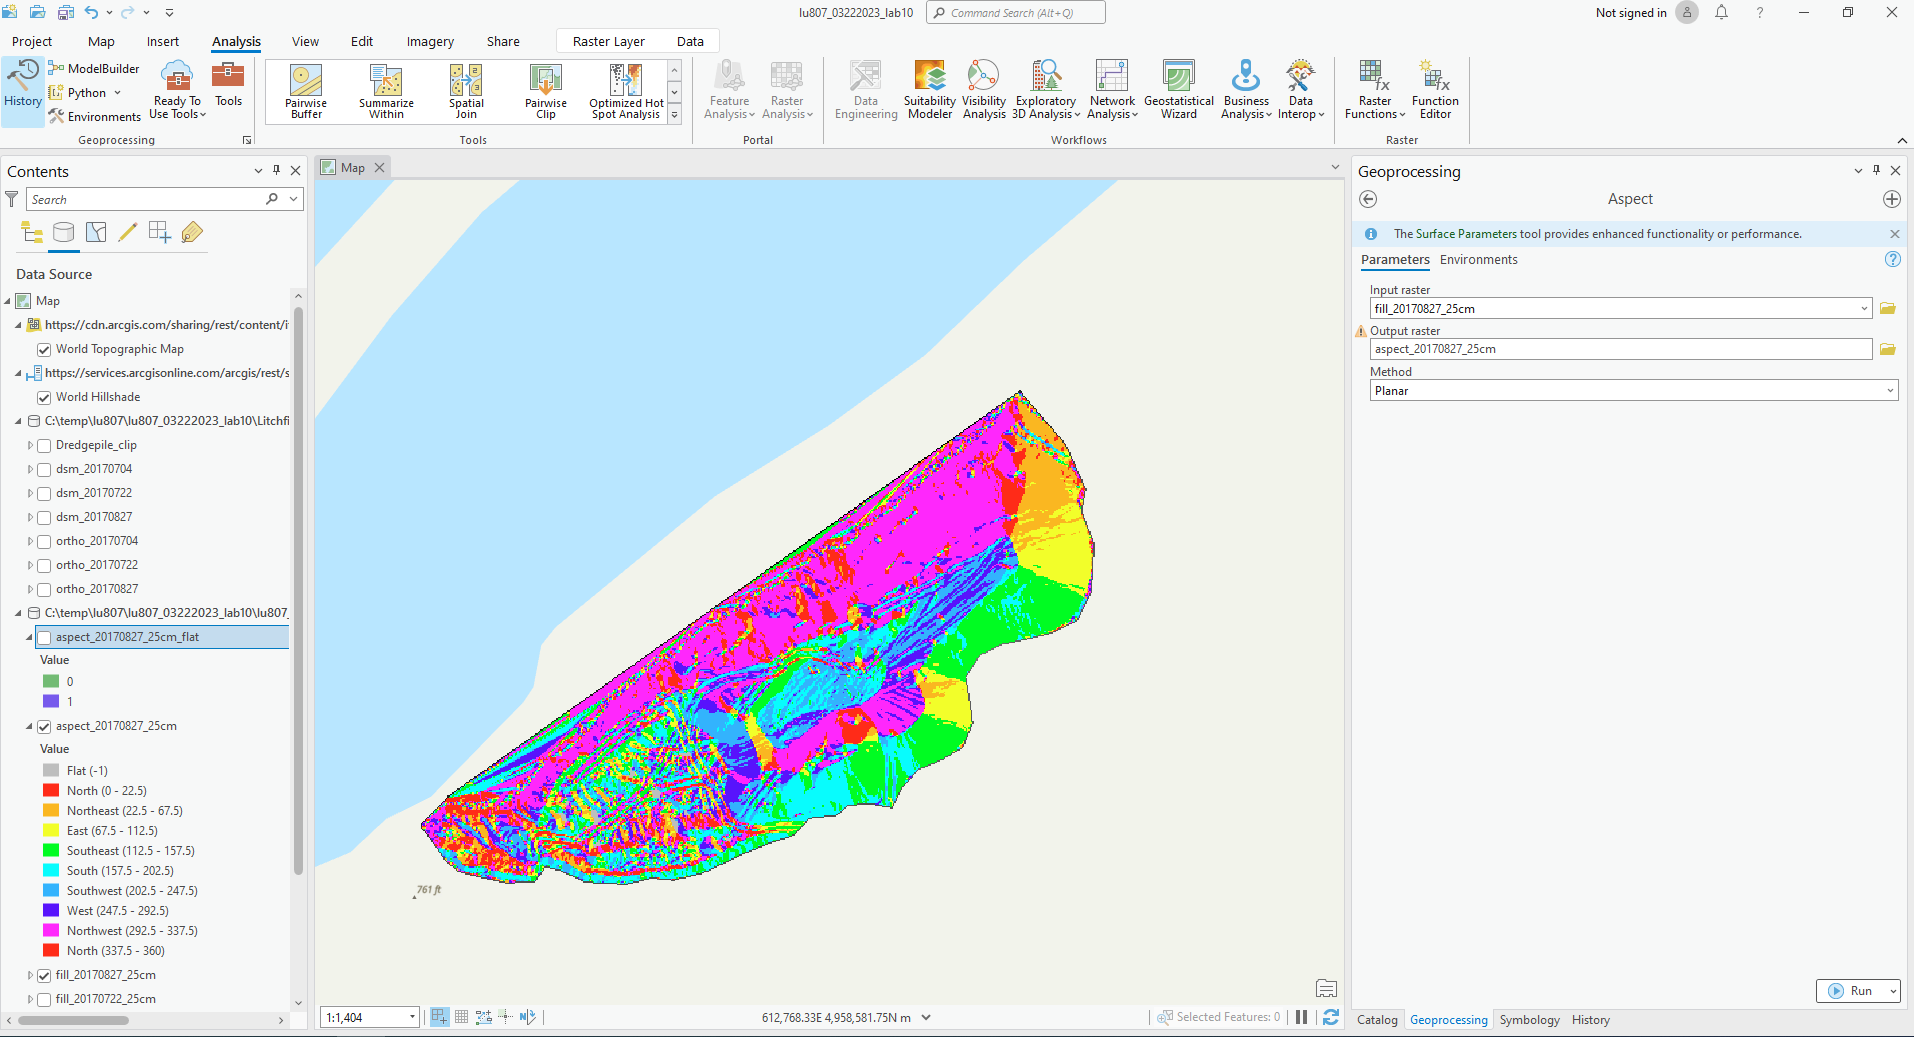
A. Aspect Tool
It can find out the facing direction of the ground. Directions are assigned in a certain numerical range. Flat is -1.
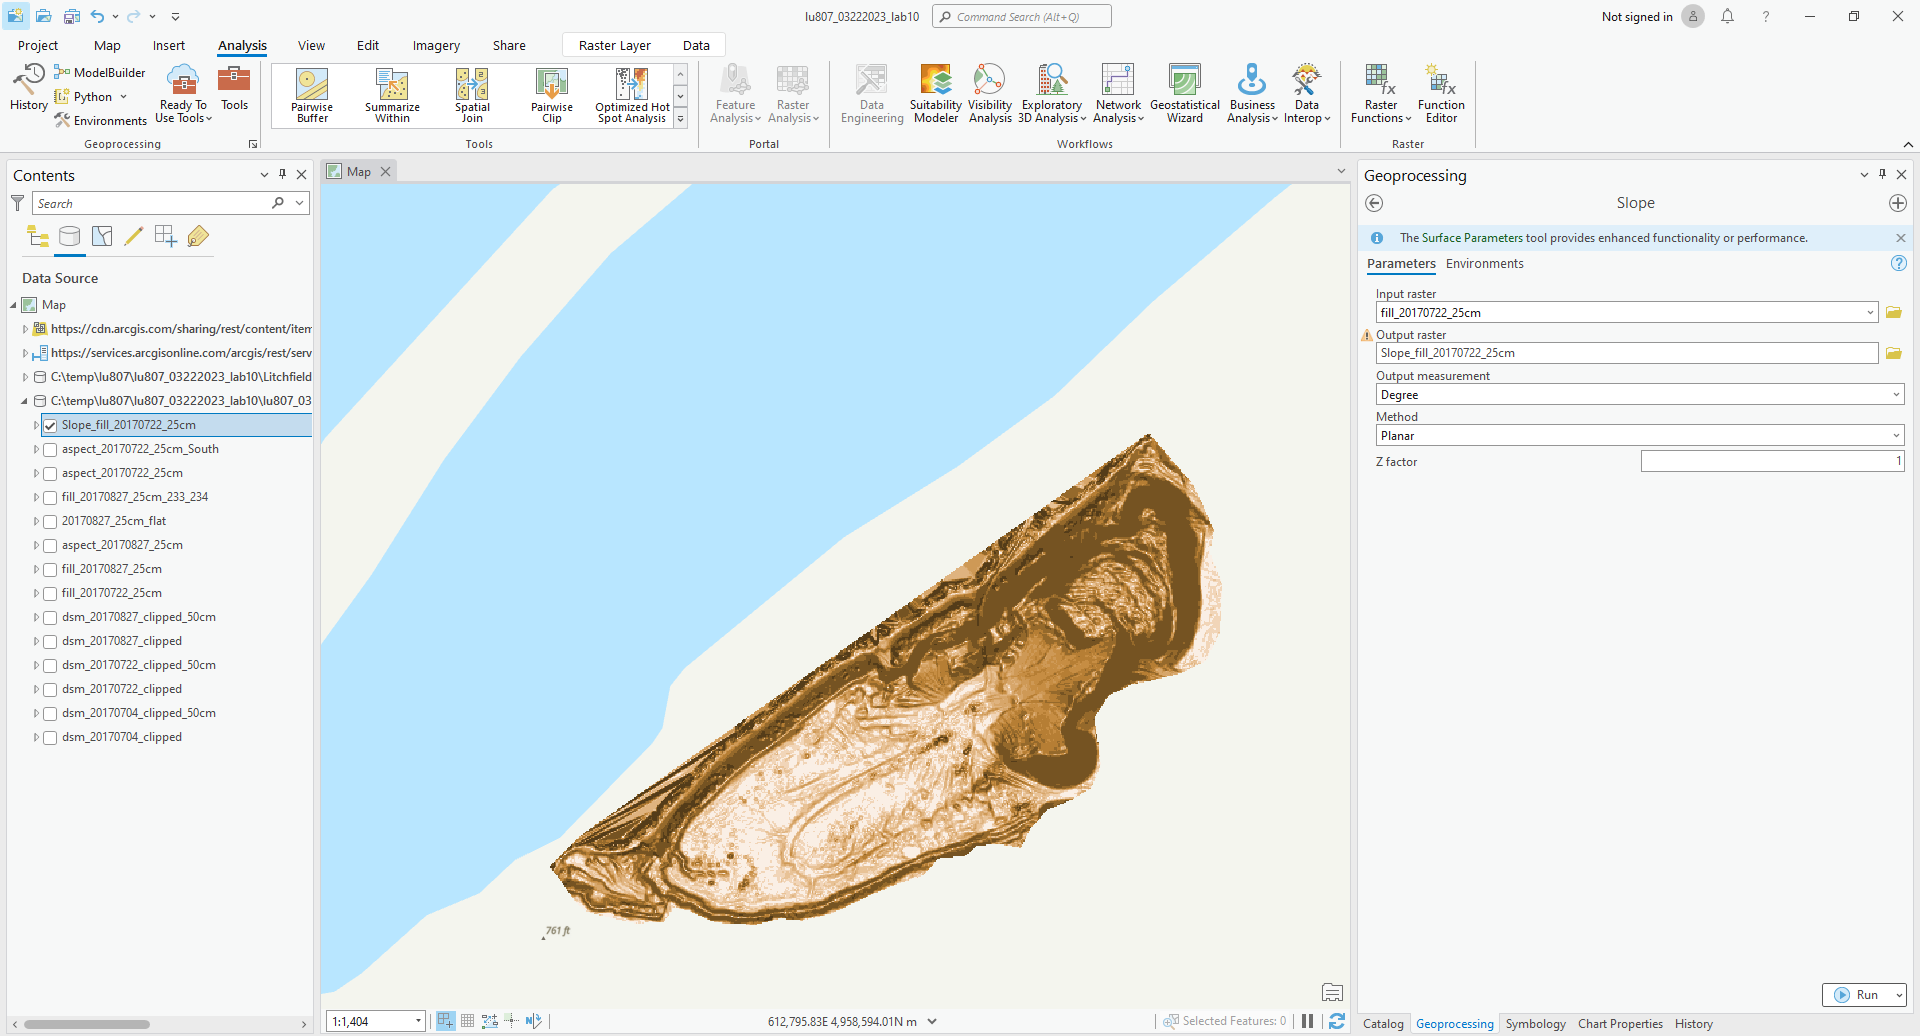
B. Slope Tool
It can calculate the slope of the ground.
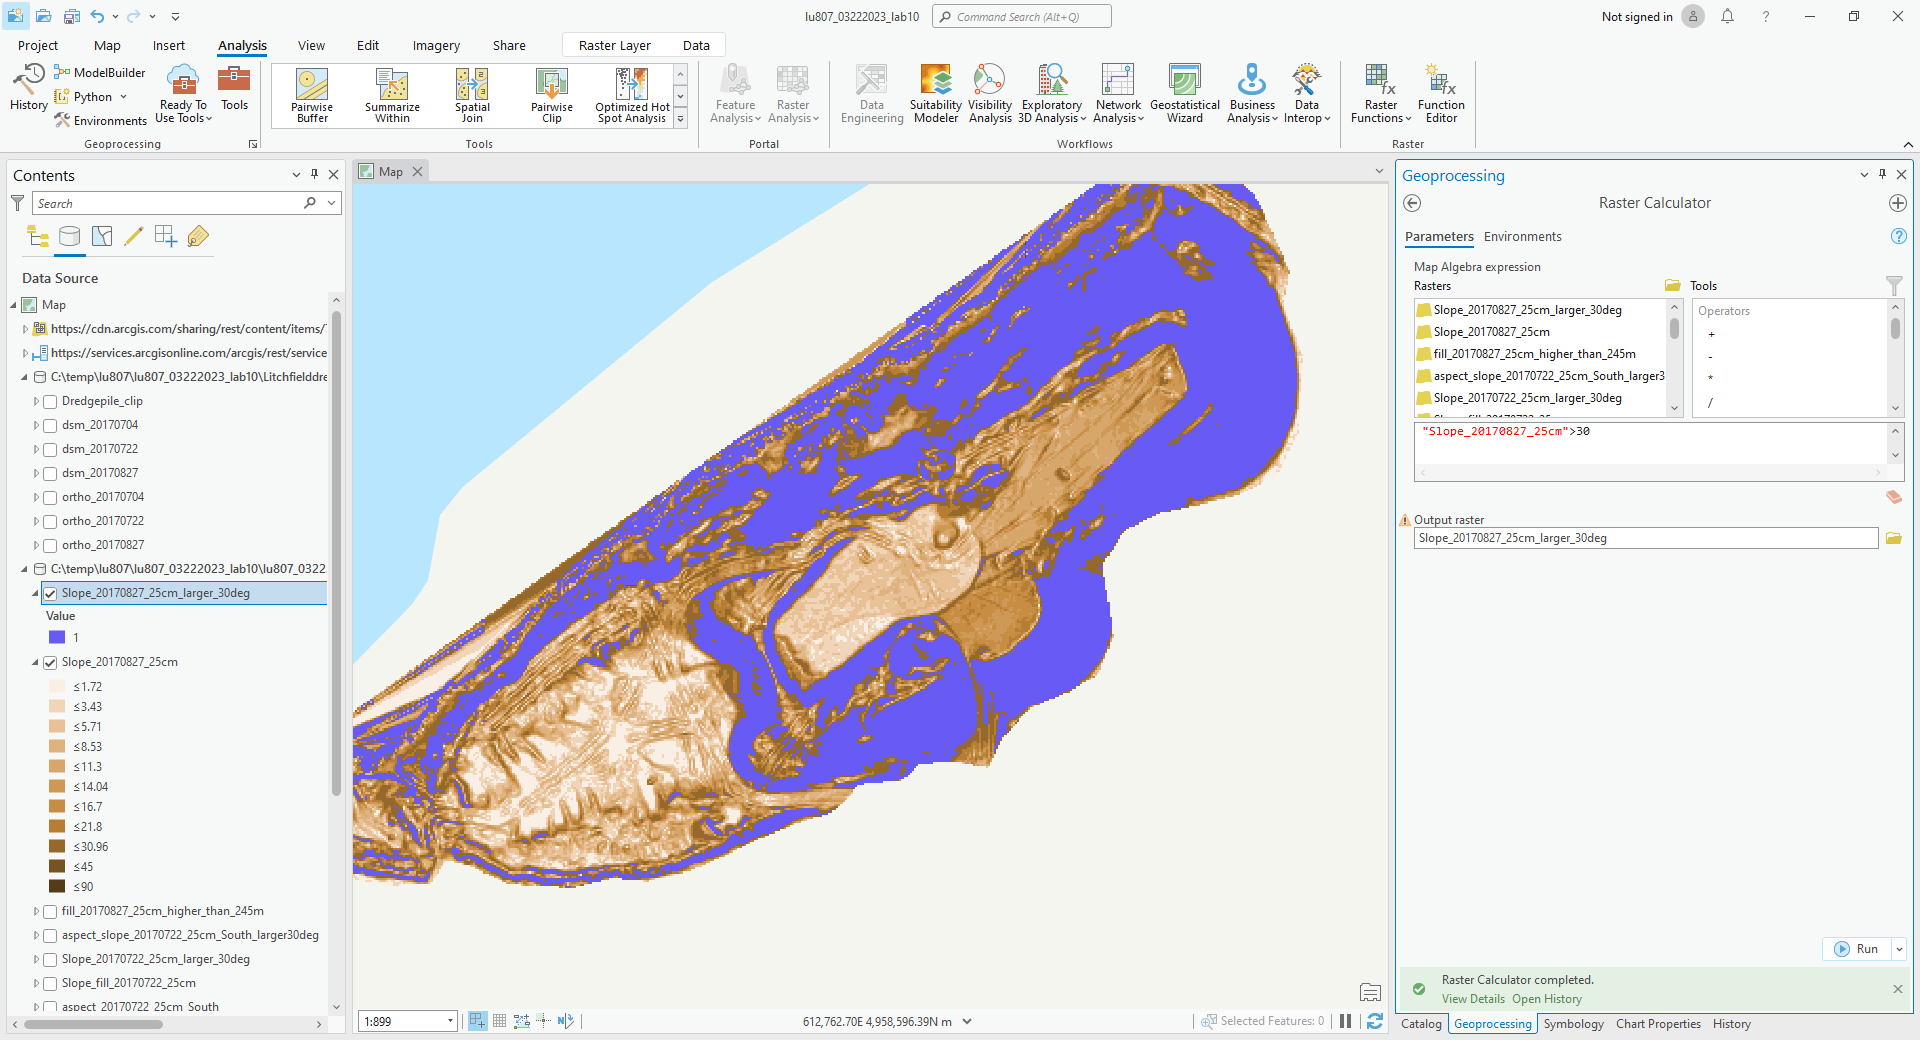
C. Raster Calculator
By inputting commands and using logic, we can output the features we want.
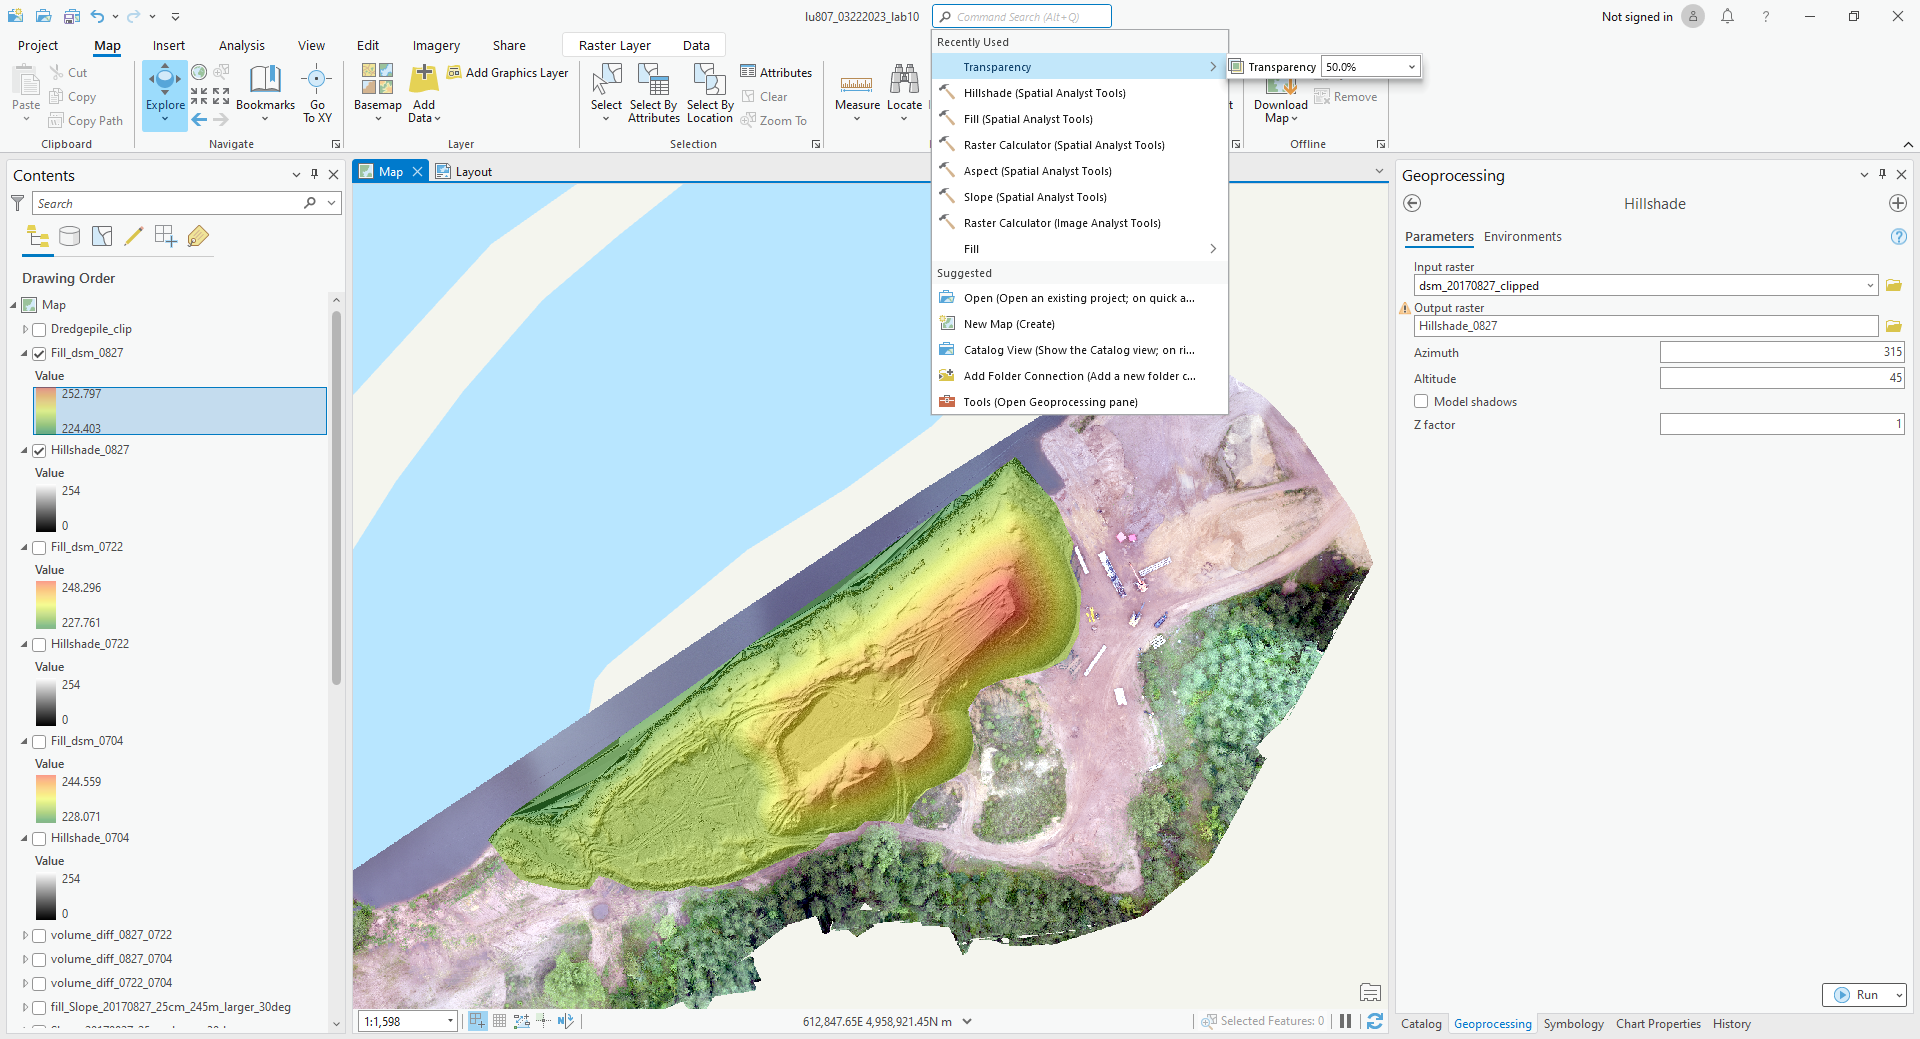
D. Hillshade and DSM
Hillshade can display the terrain. By changing the color of DSM and its transparency, we can display the height with different colors.
E. Analysis
(1). Where are the flat areas on 0827?
(2). Find all areas between 233 m and 234 m on 0827.
(3). Find out all slopes that are facing south and over 30 degrees on 0722 (unsafe).
(4). Find out where the pile is over 245 m on 0827.
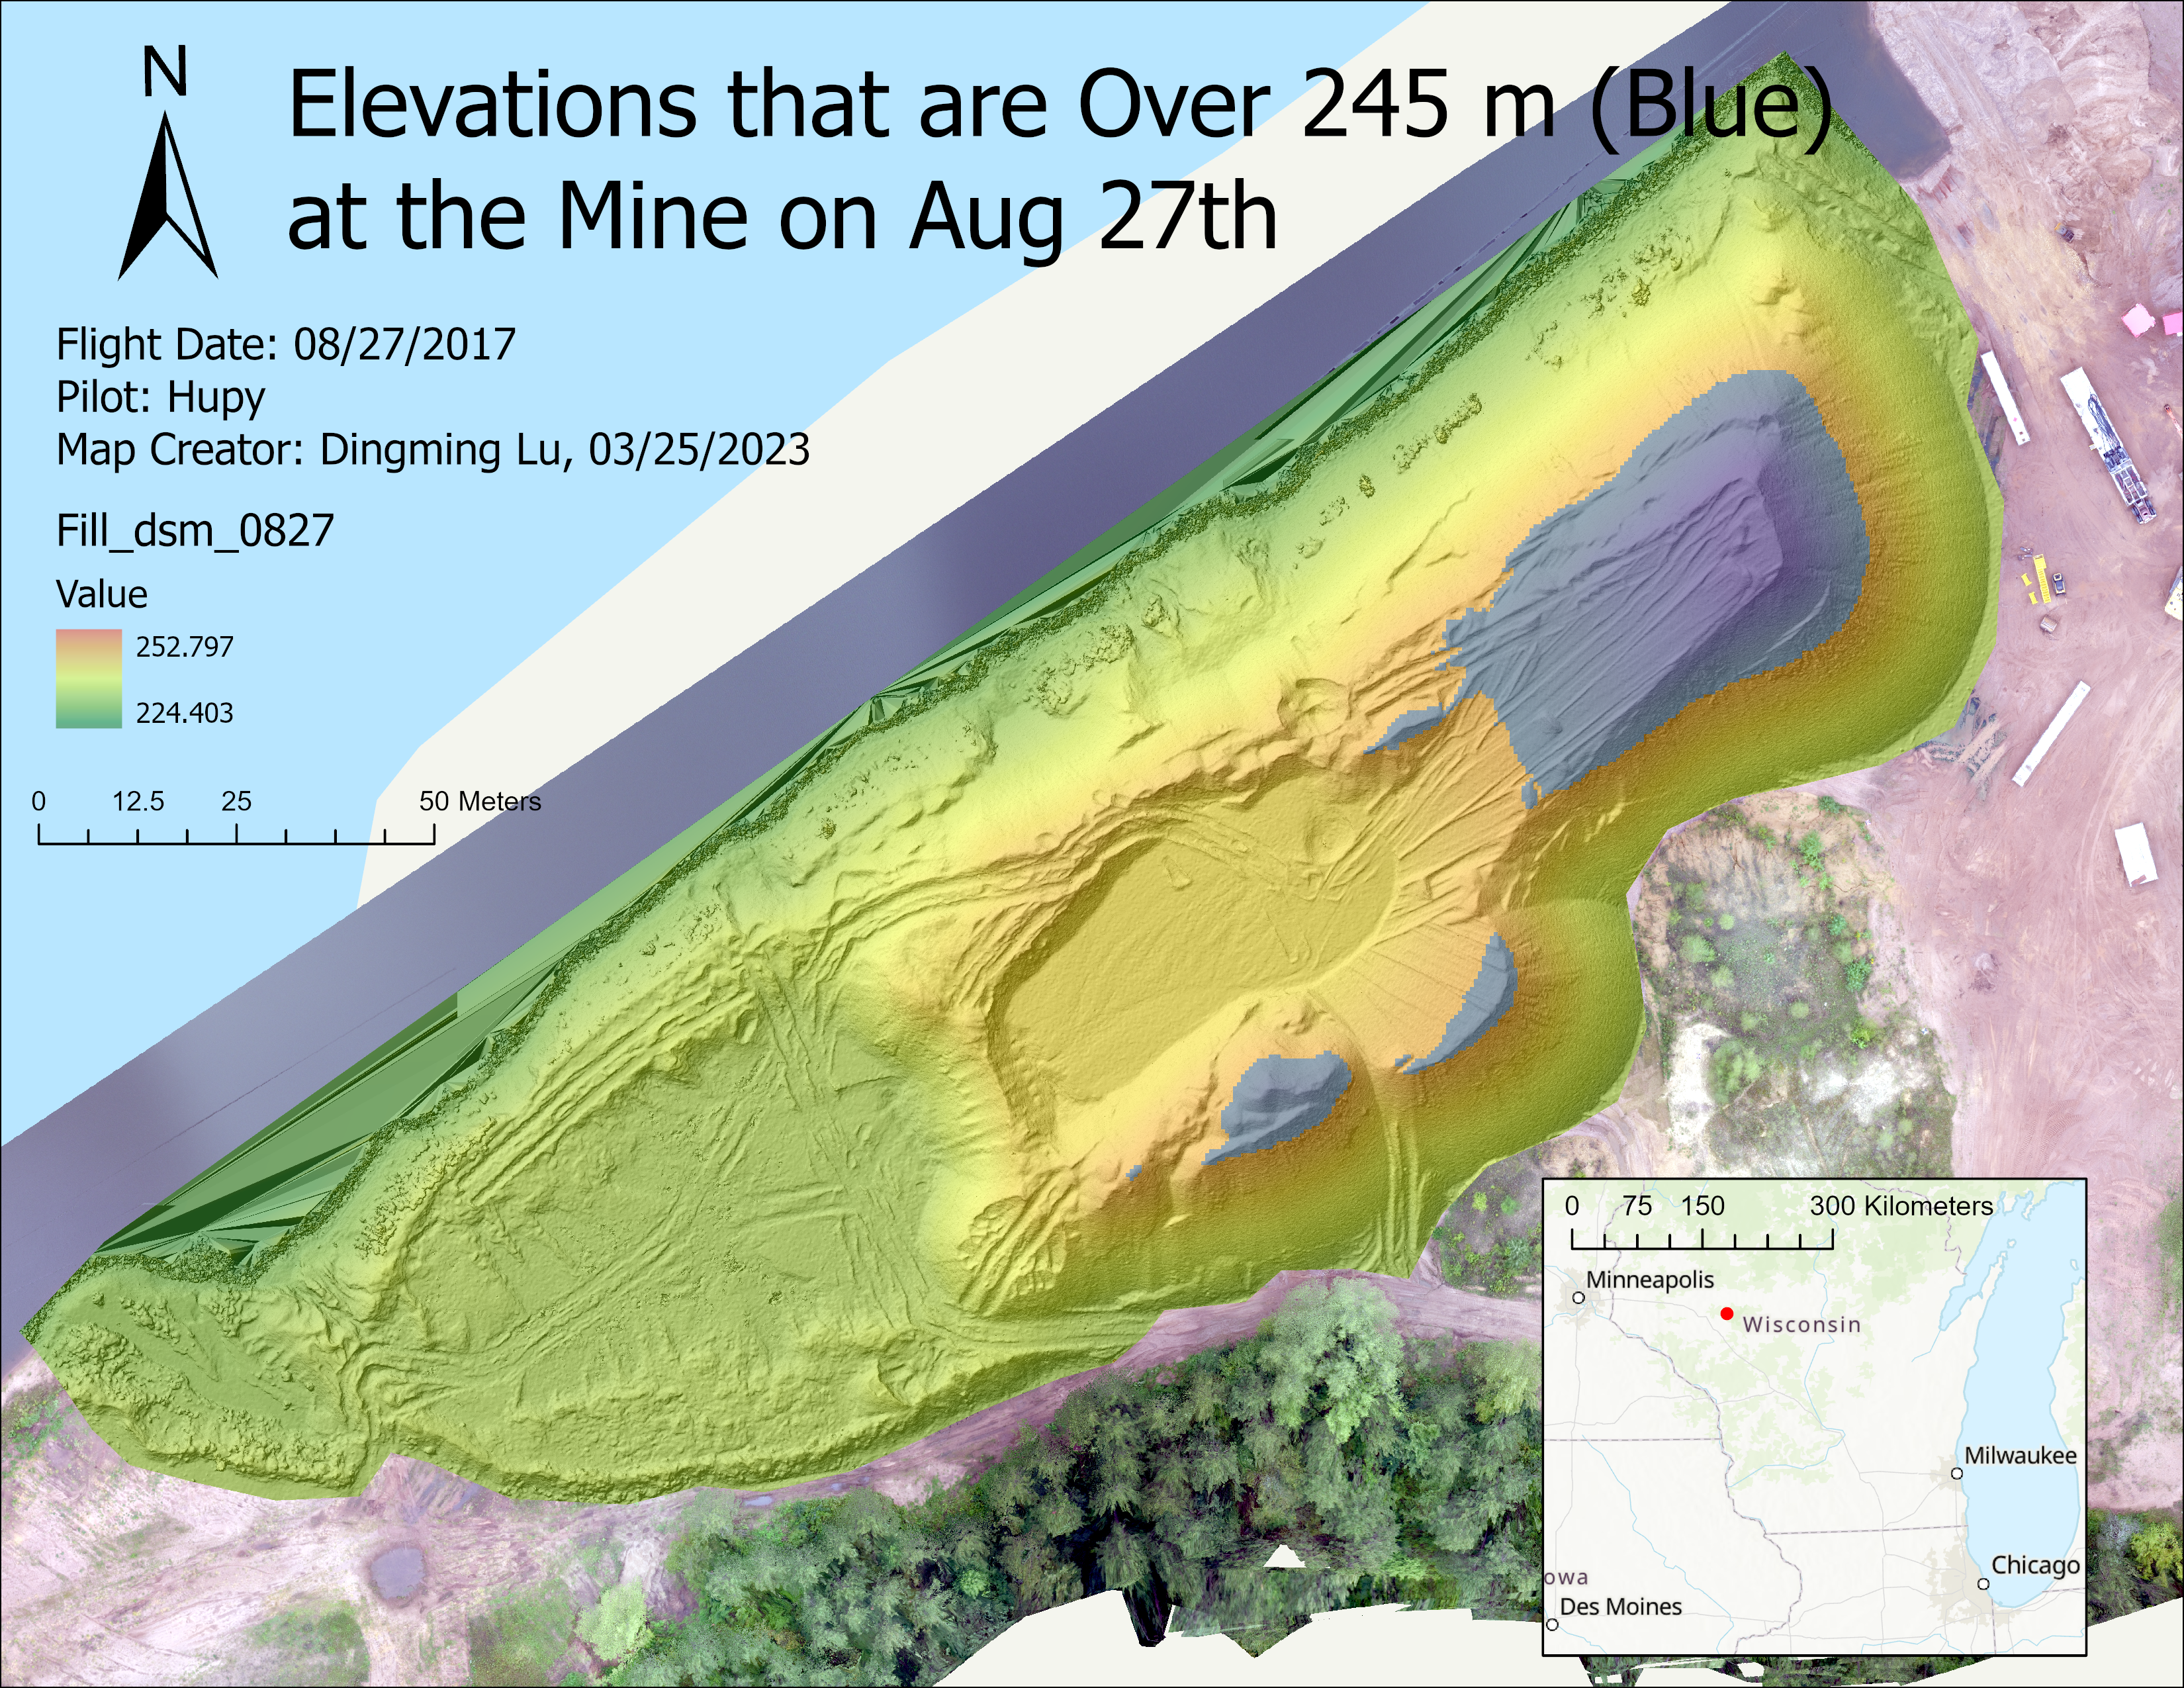
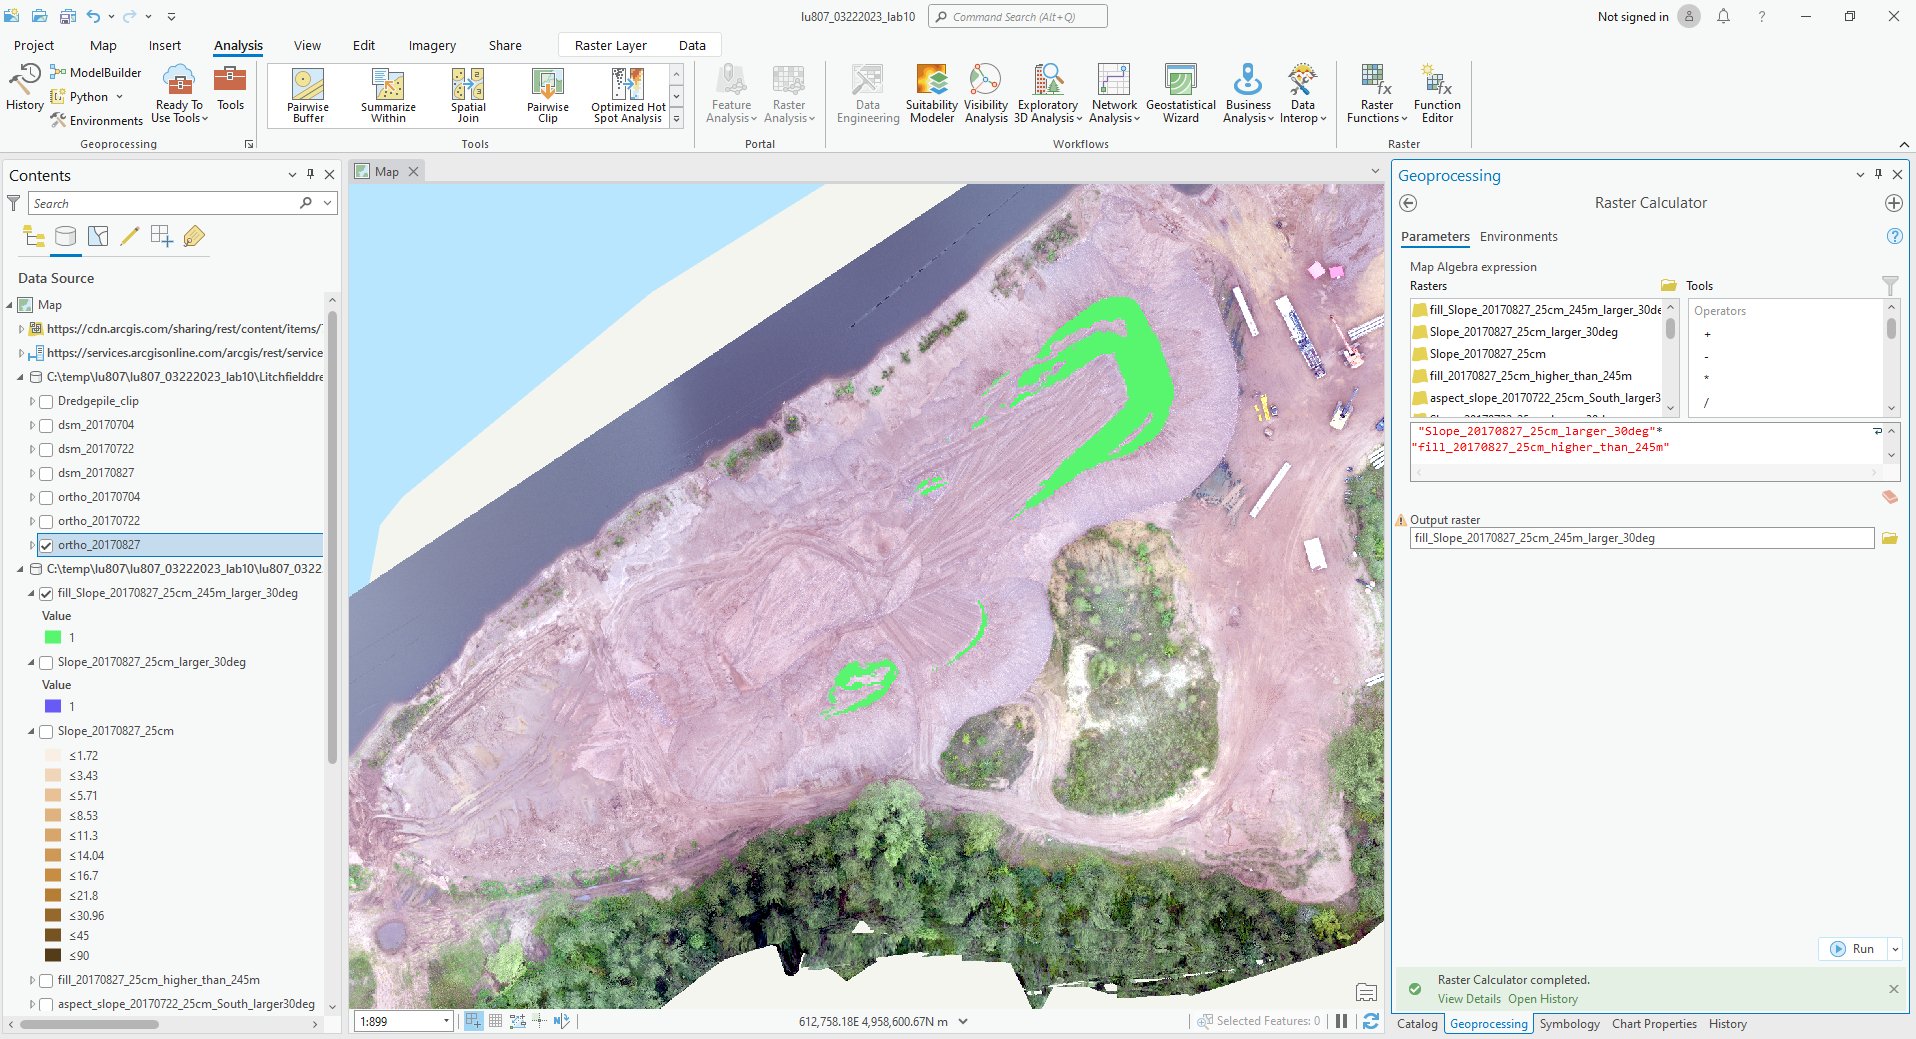
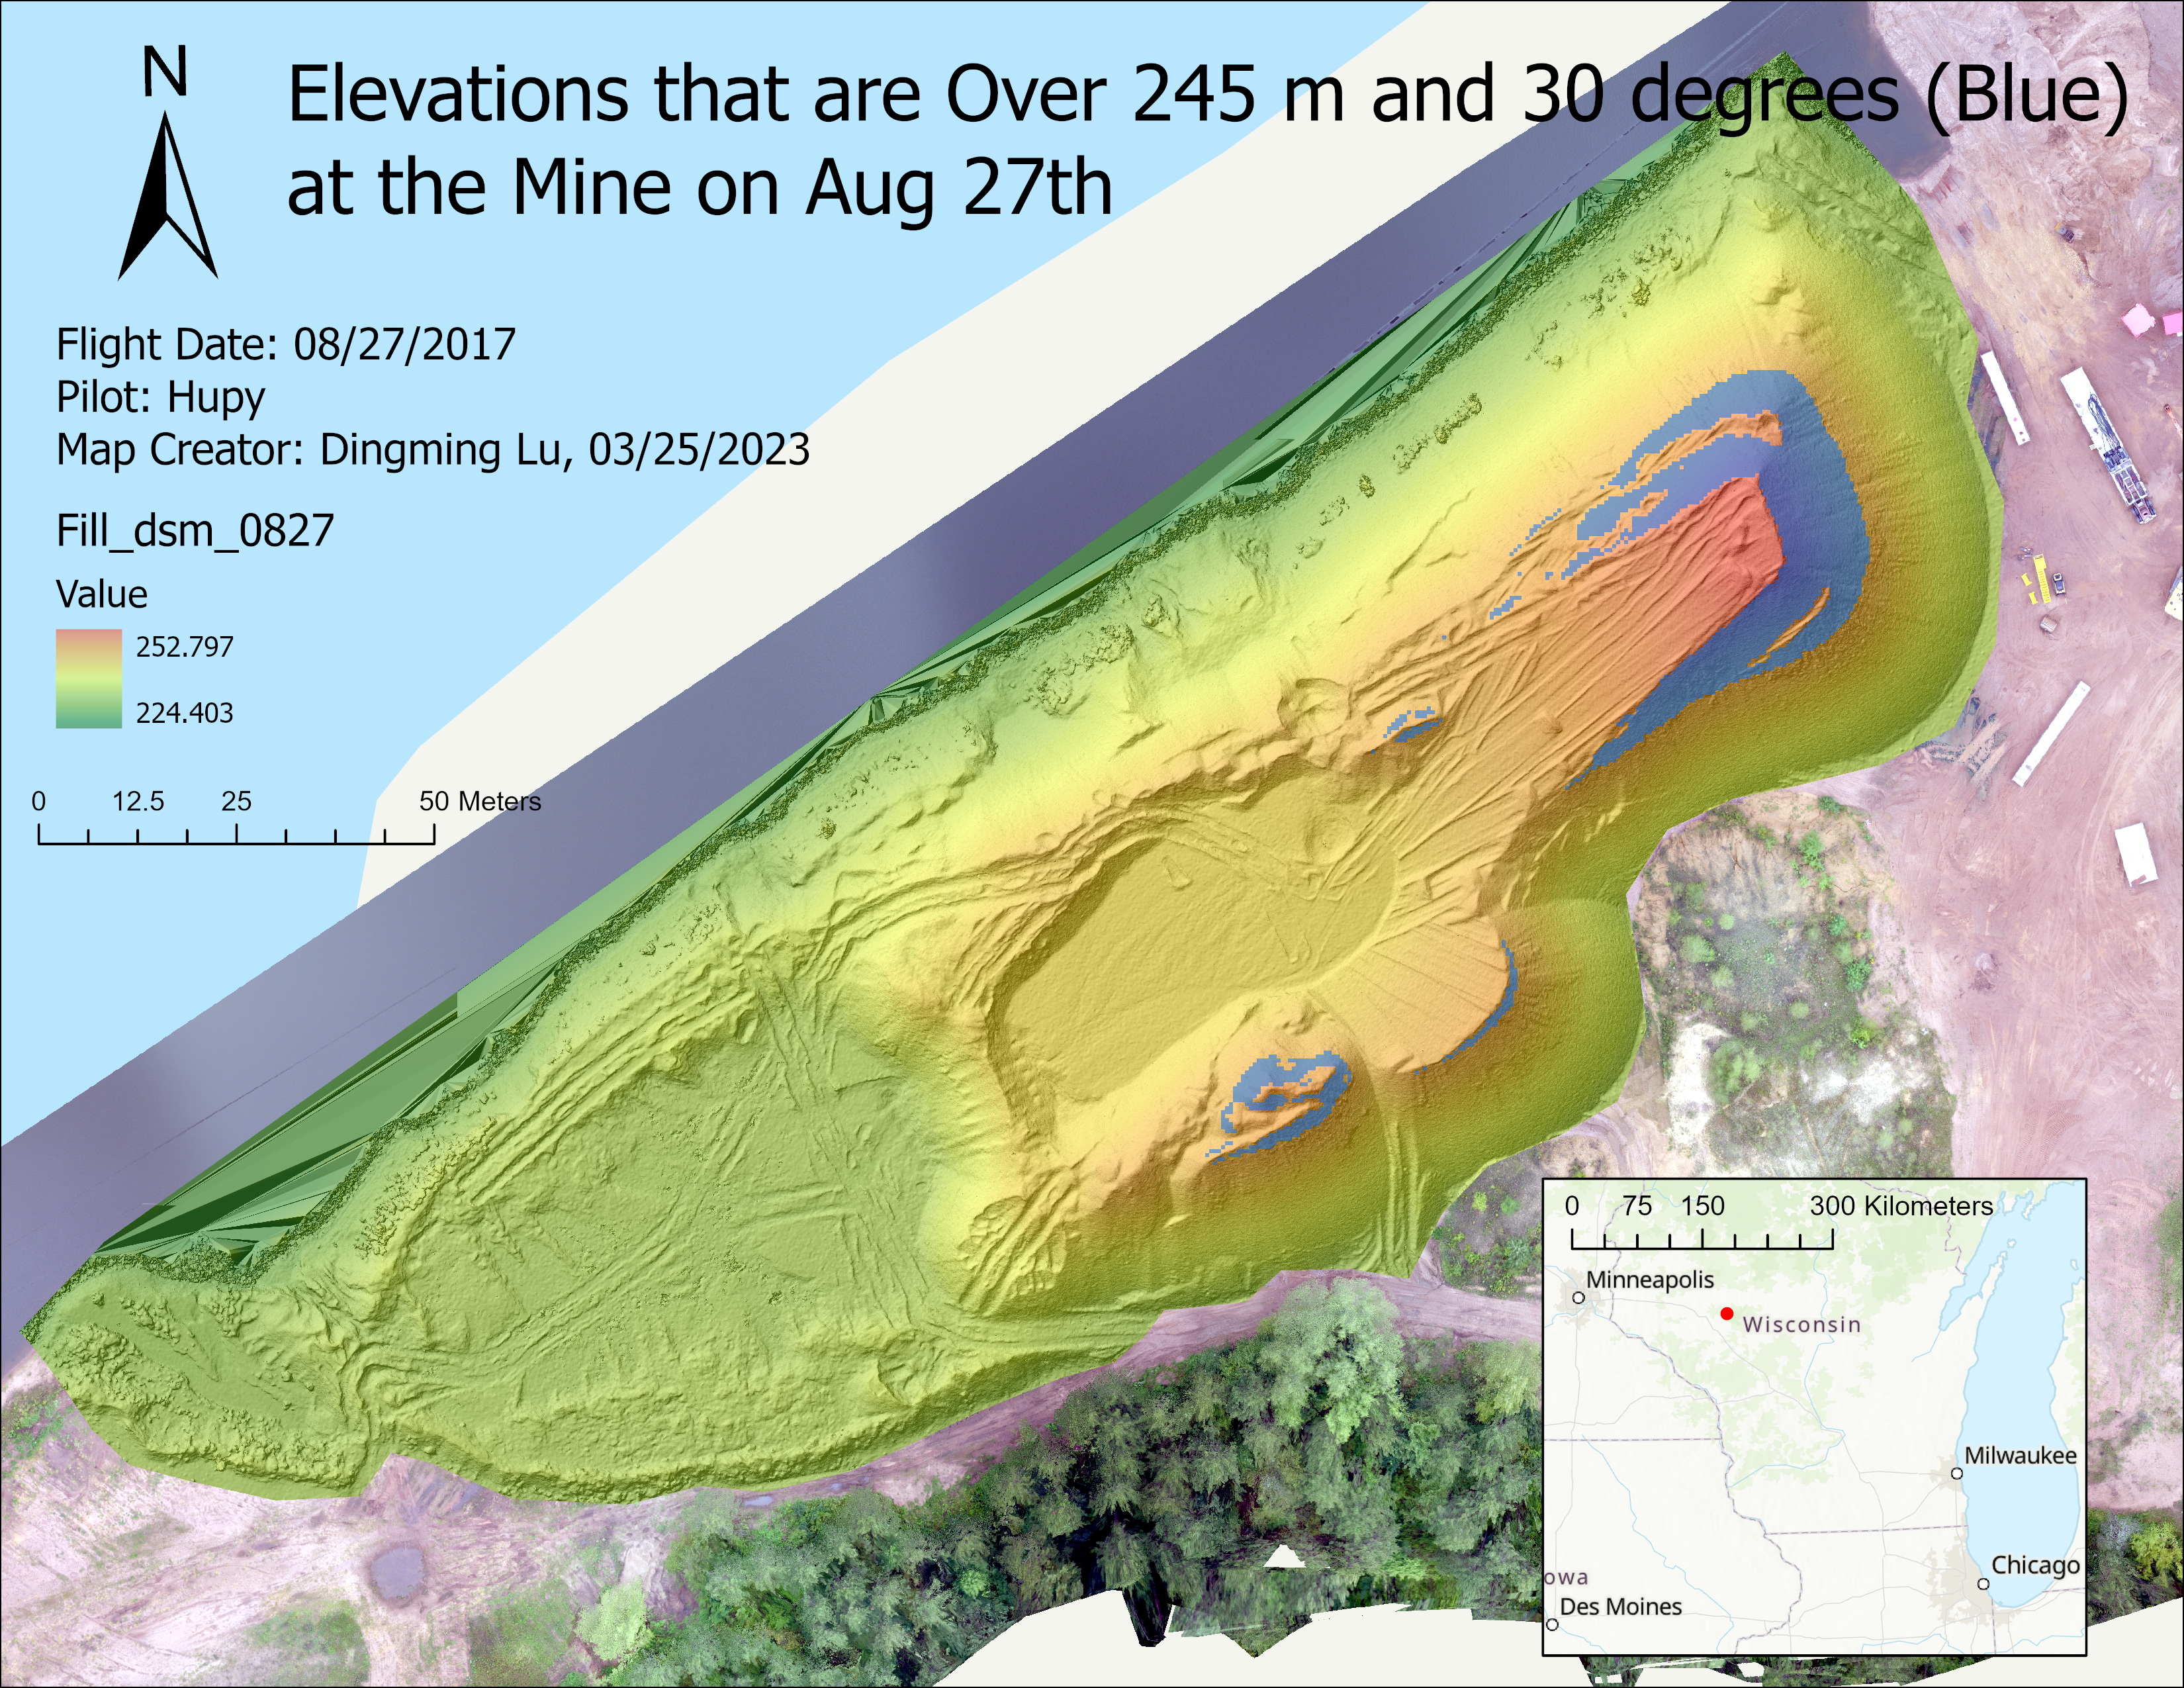
(5). In the area over 245 m, find the slops that is over 30 degrees.
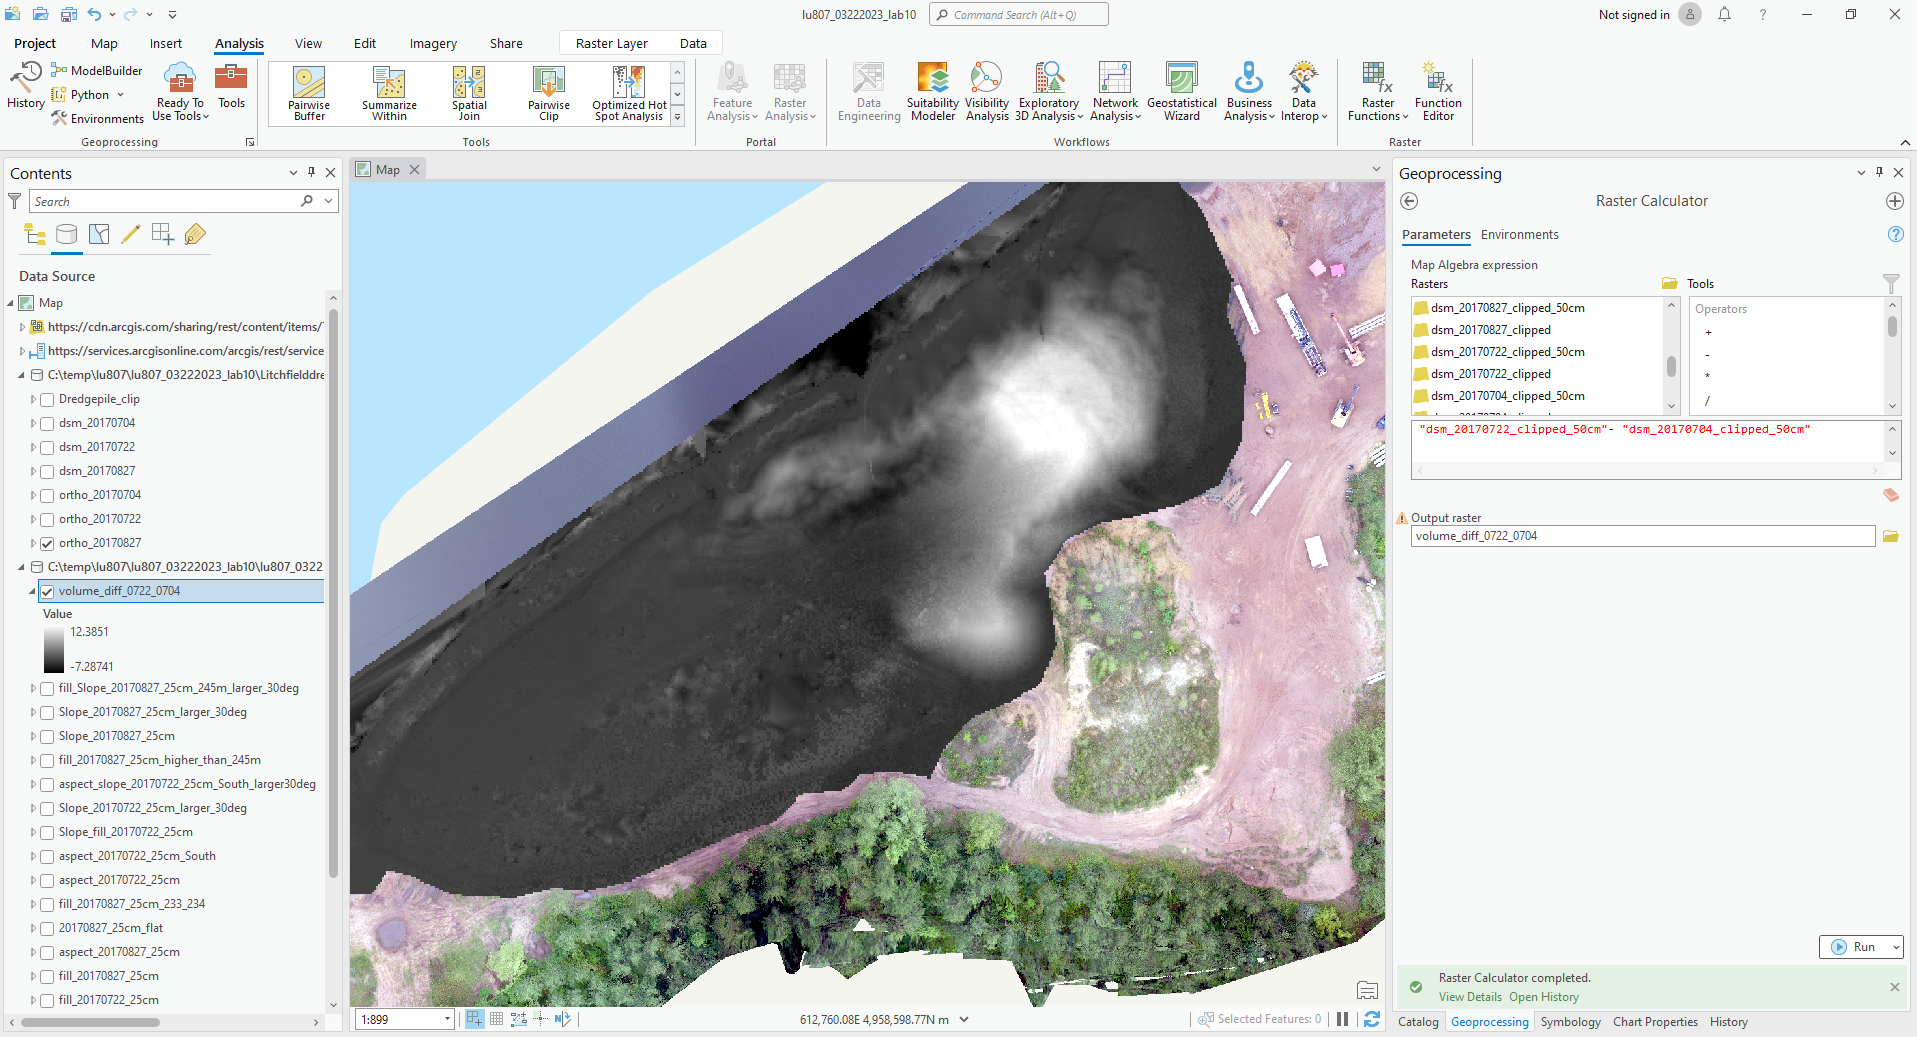
(6). Find the difference between 0722 and 0704.
(7). Find the difference between 0827 and 0704.
(8). Find the difference between 0827 and 0722.
