I. Intro
Date: 03/01/2023
During this lab, we worked with joined tables and see the difference behaviors of different boundaries (county, fishnet, and zipcode) in hotspot features.
II. Unify Projection and Query out Indiana Airmen
Projection of each feature:
- Airmen_pts_cont_us: WGS 1984
- Fishnet_10km_cont_us: North America Lambert Conformal Conic
- Us_zipcode_cont: NAD 1983
- Continental_us_counties_lambert: North America Lambert Conformal Conic
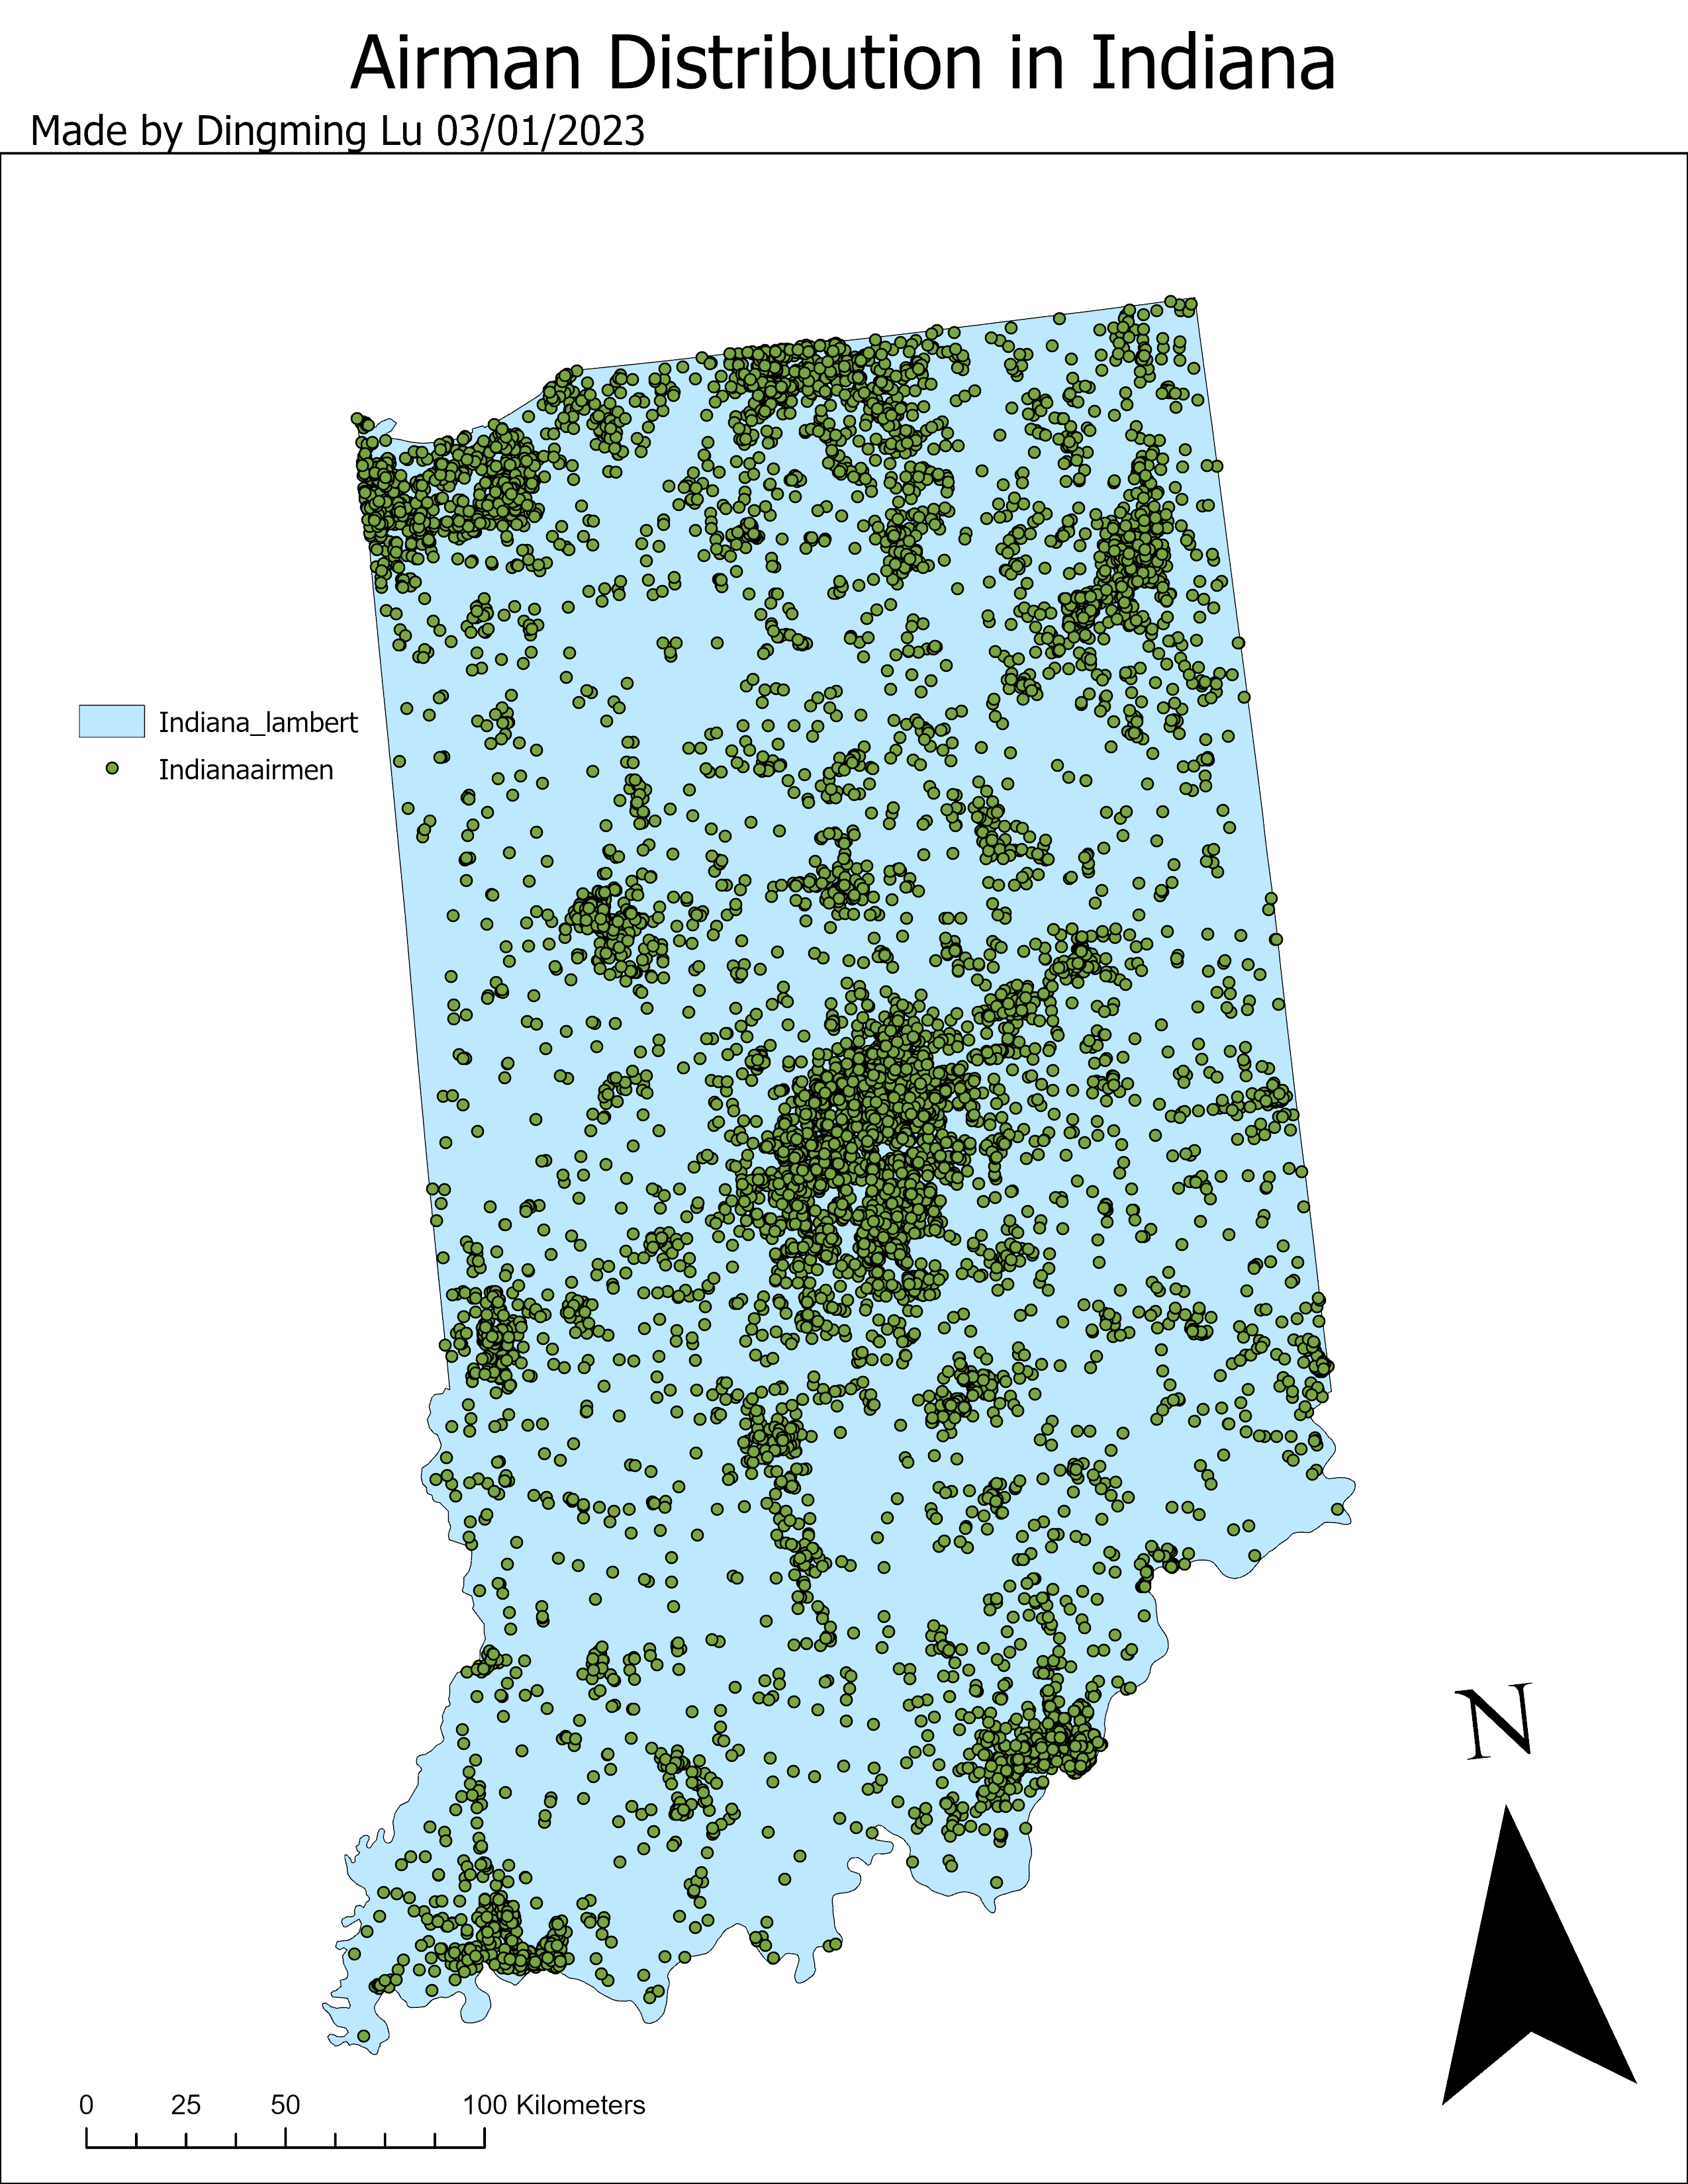
Referring to Lab 06, use Lasso Tool to export the Indiana boundary, and clip on the airmen database, we got:
III. Hotspot Analysis
A. Creat Feature Class
Clip the zipcode, fishnet, and county from the entire US layer with the Indiana state boundary.
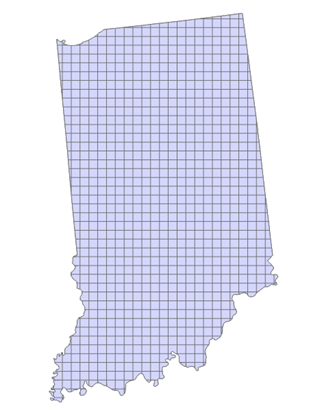
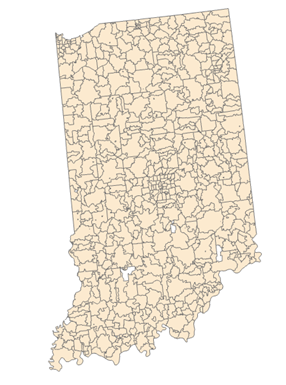
Figure 2: Fishnet over Indiana (Left) and Zipcode areas over Indiana (Right)
B. Spatial Join
- Use “Spatial Join” tool,
- set target feature to Indiana counties feature class,
- set Join Features with Indiana airmen feature class,
- name the output,
- set join operation to one to one,
- set match operation to interest.
- Repeat it for zipcode and fishnet feature class.
C. Hot Spot Analysis
- Use “Optimized hot spot analysis”,
- set input to joined fishnet,
- name the output, set analysis field to join_count
- Repeat the steps for zipcode and county features.
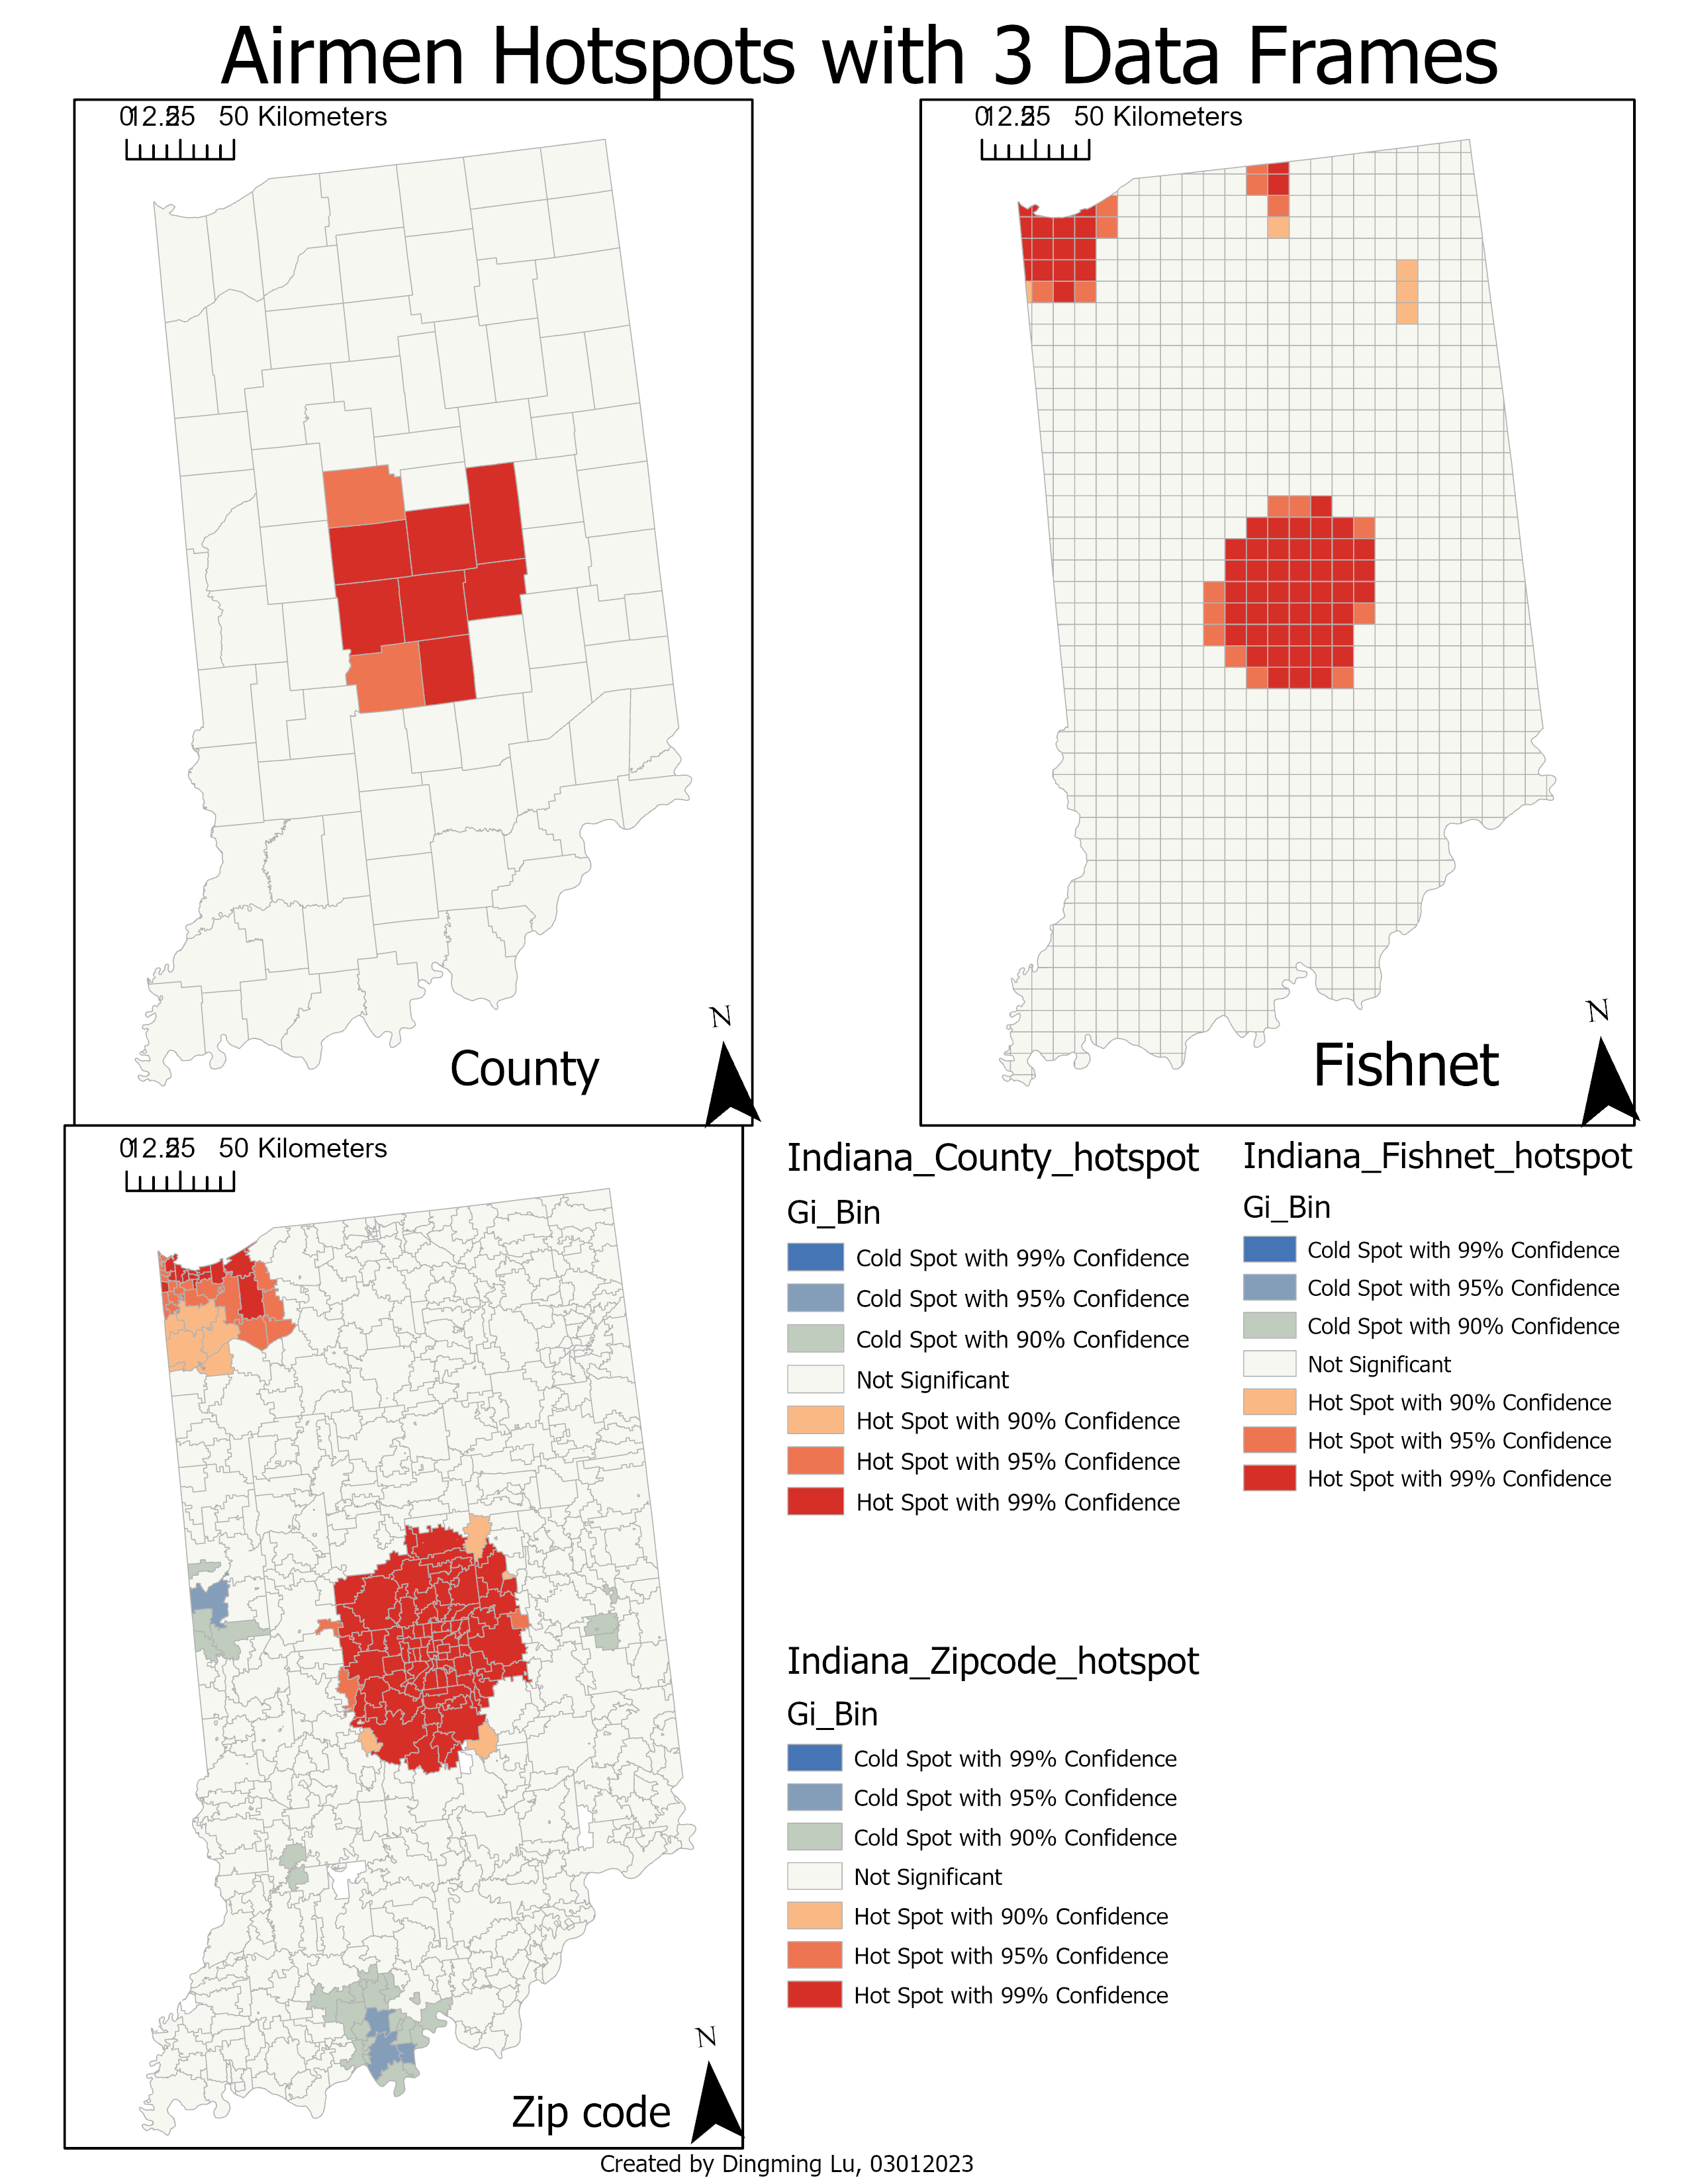
County: The hot spot only focuses on the area near Indianapolis. It has the worst resolution, so it’s not as detailed as other frame.
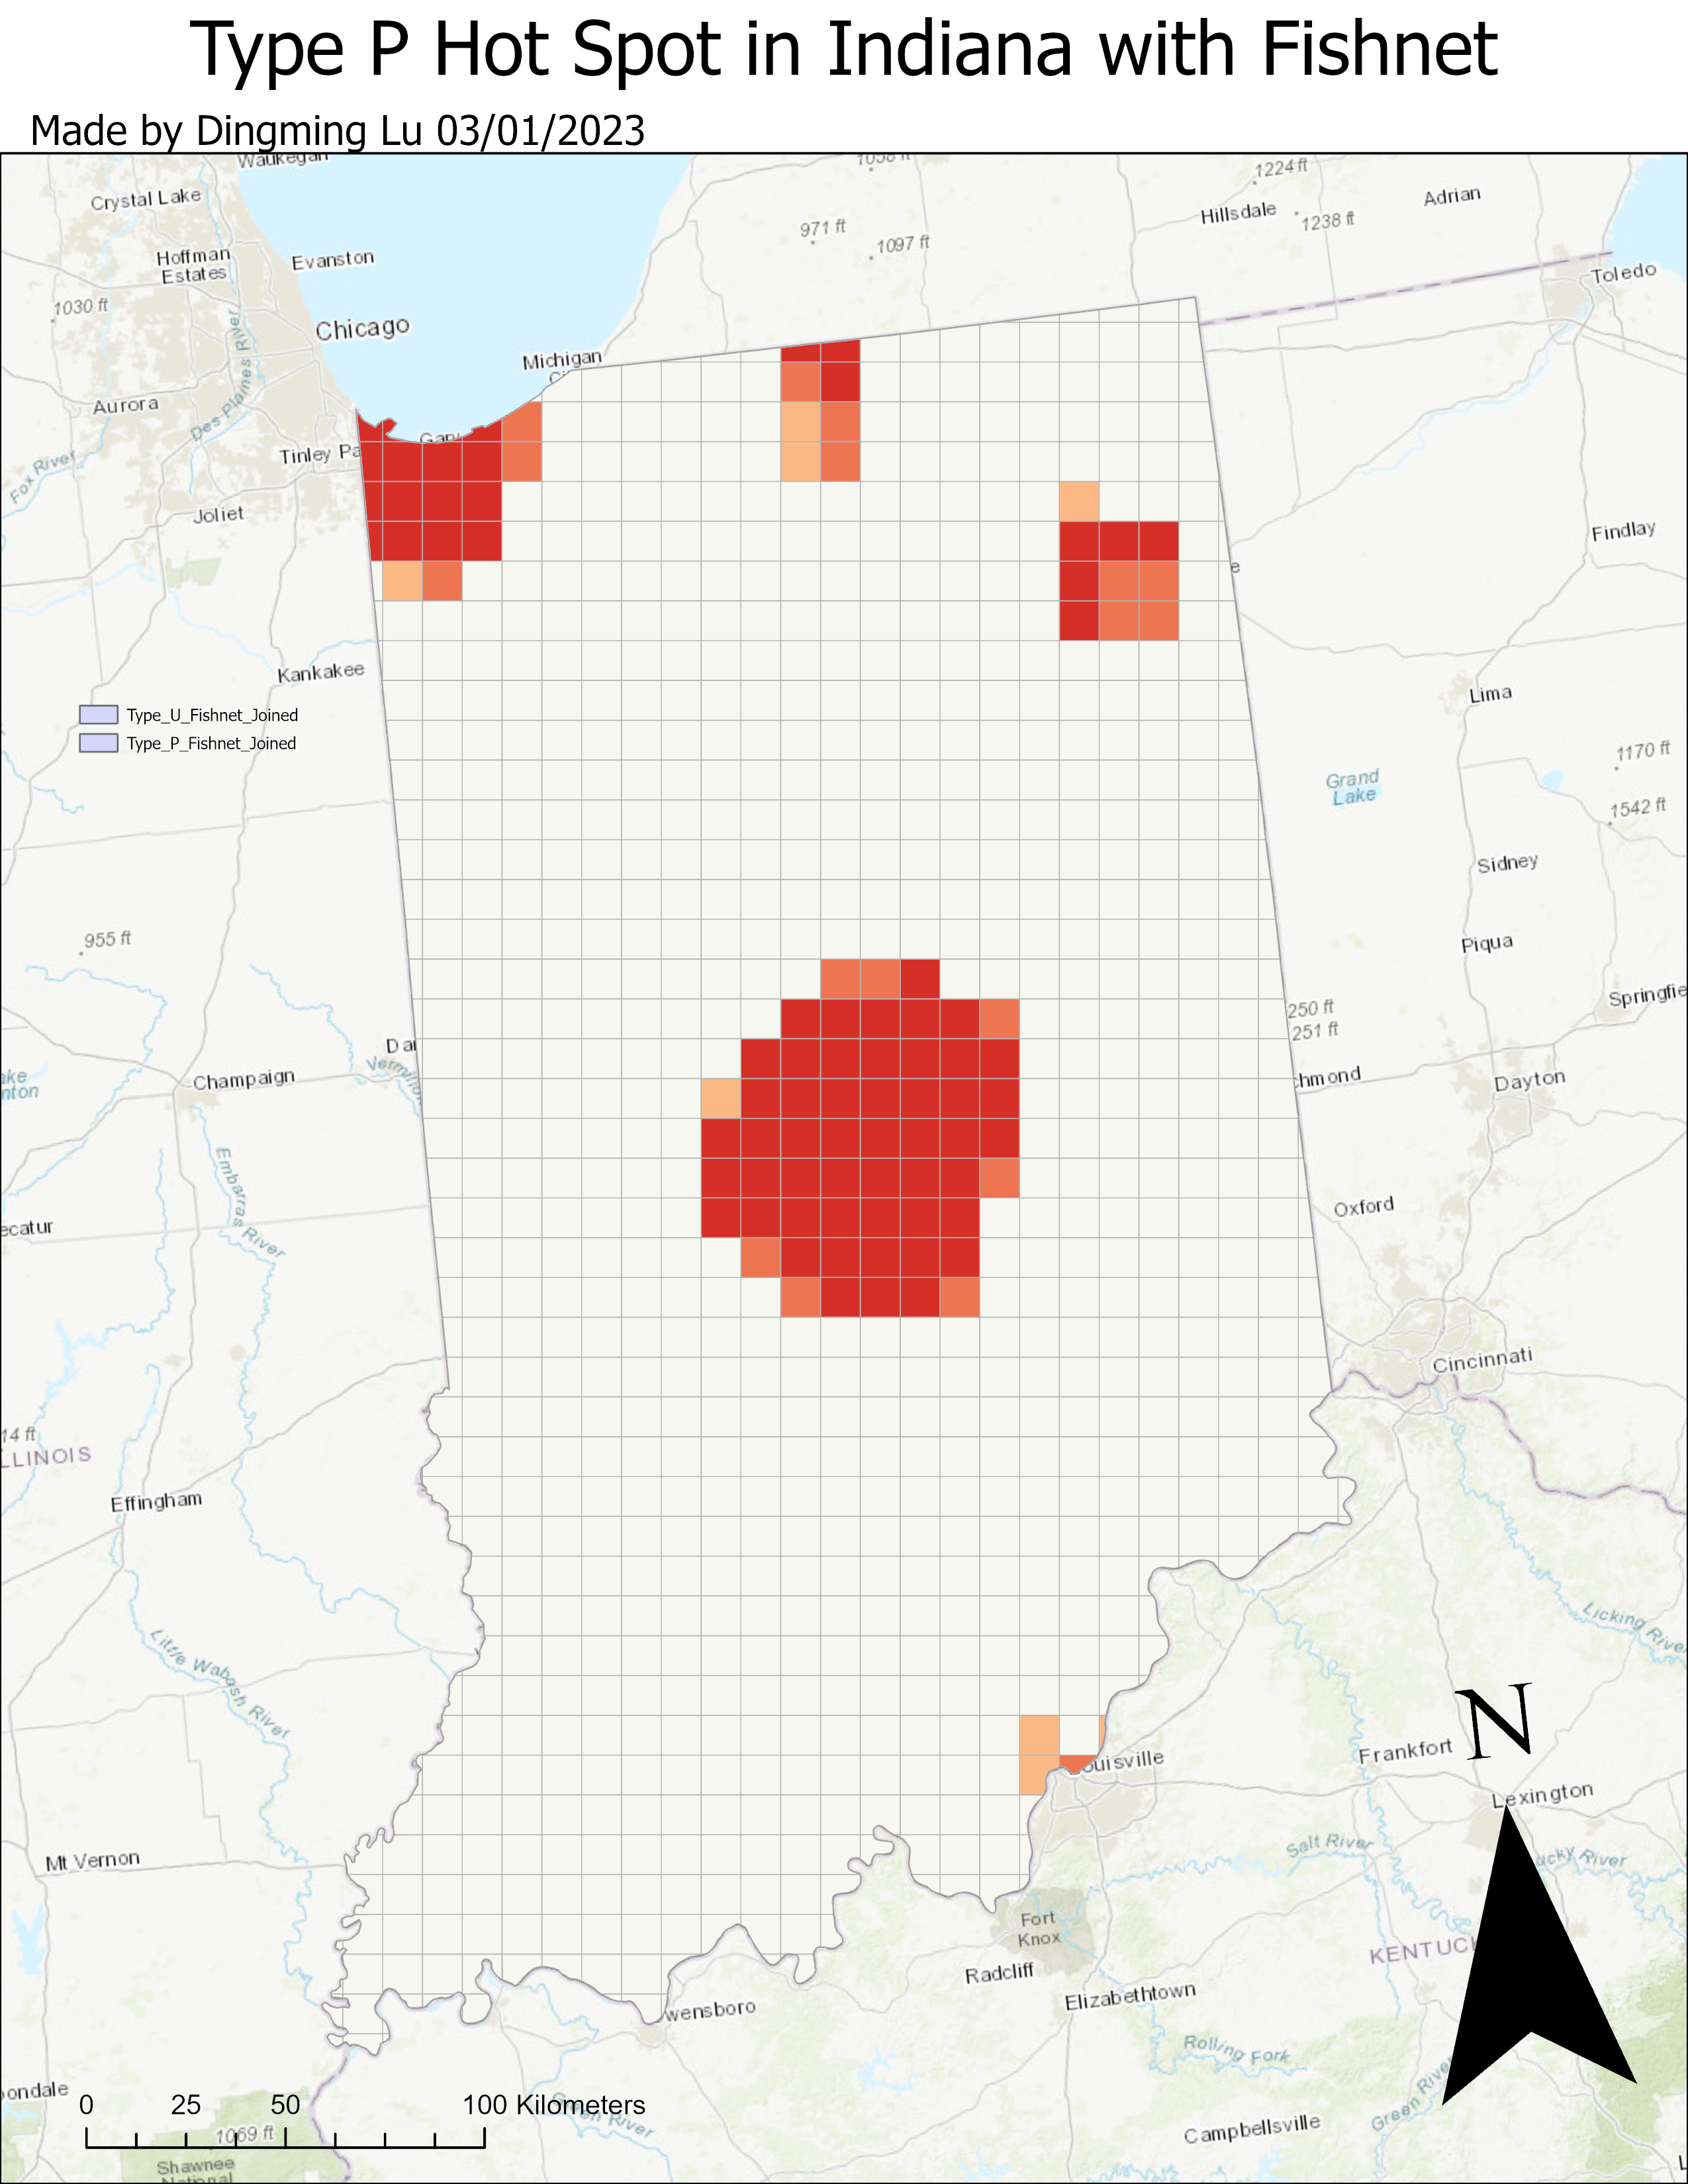
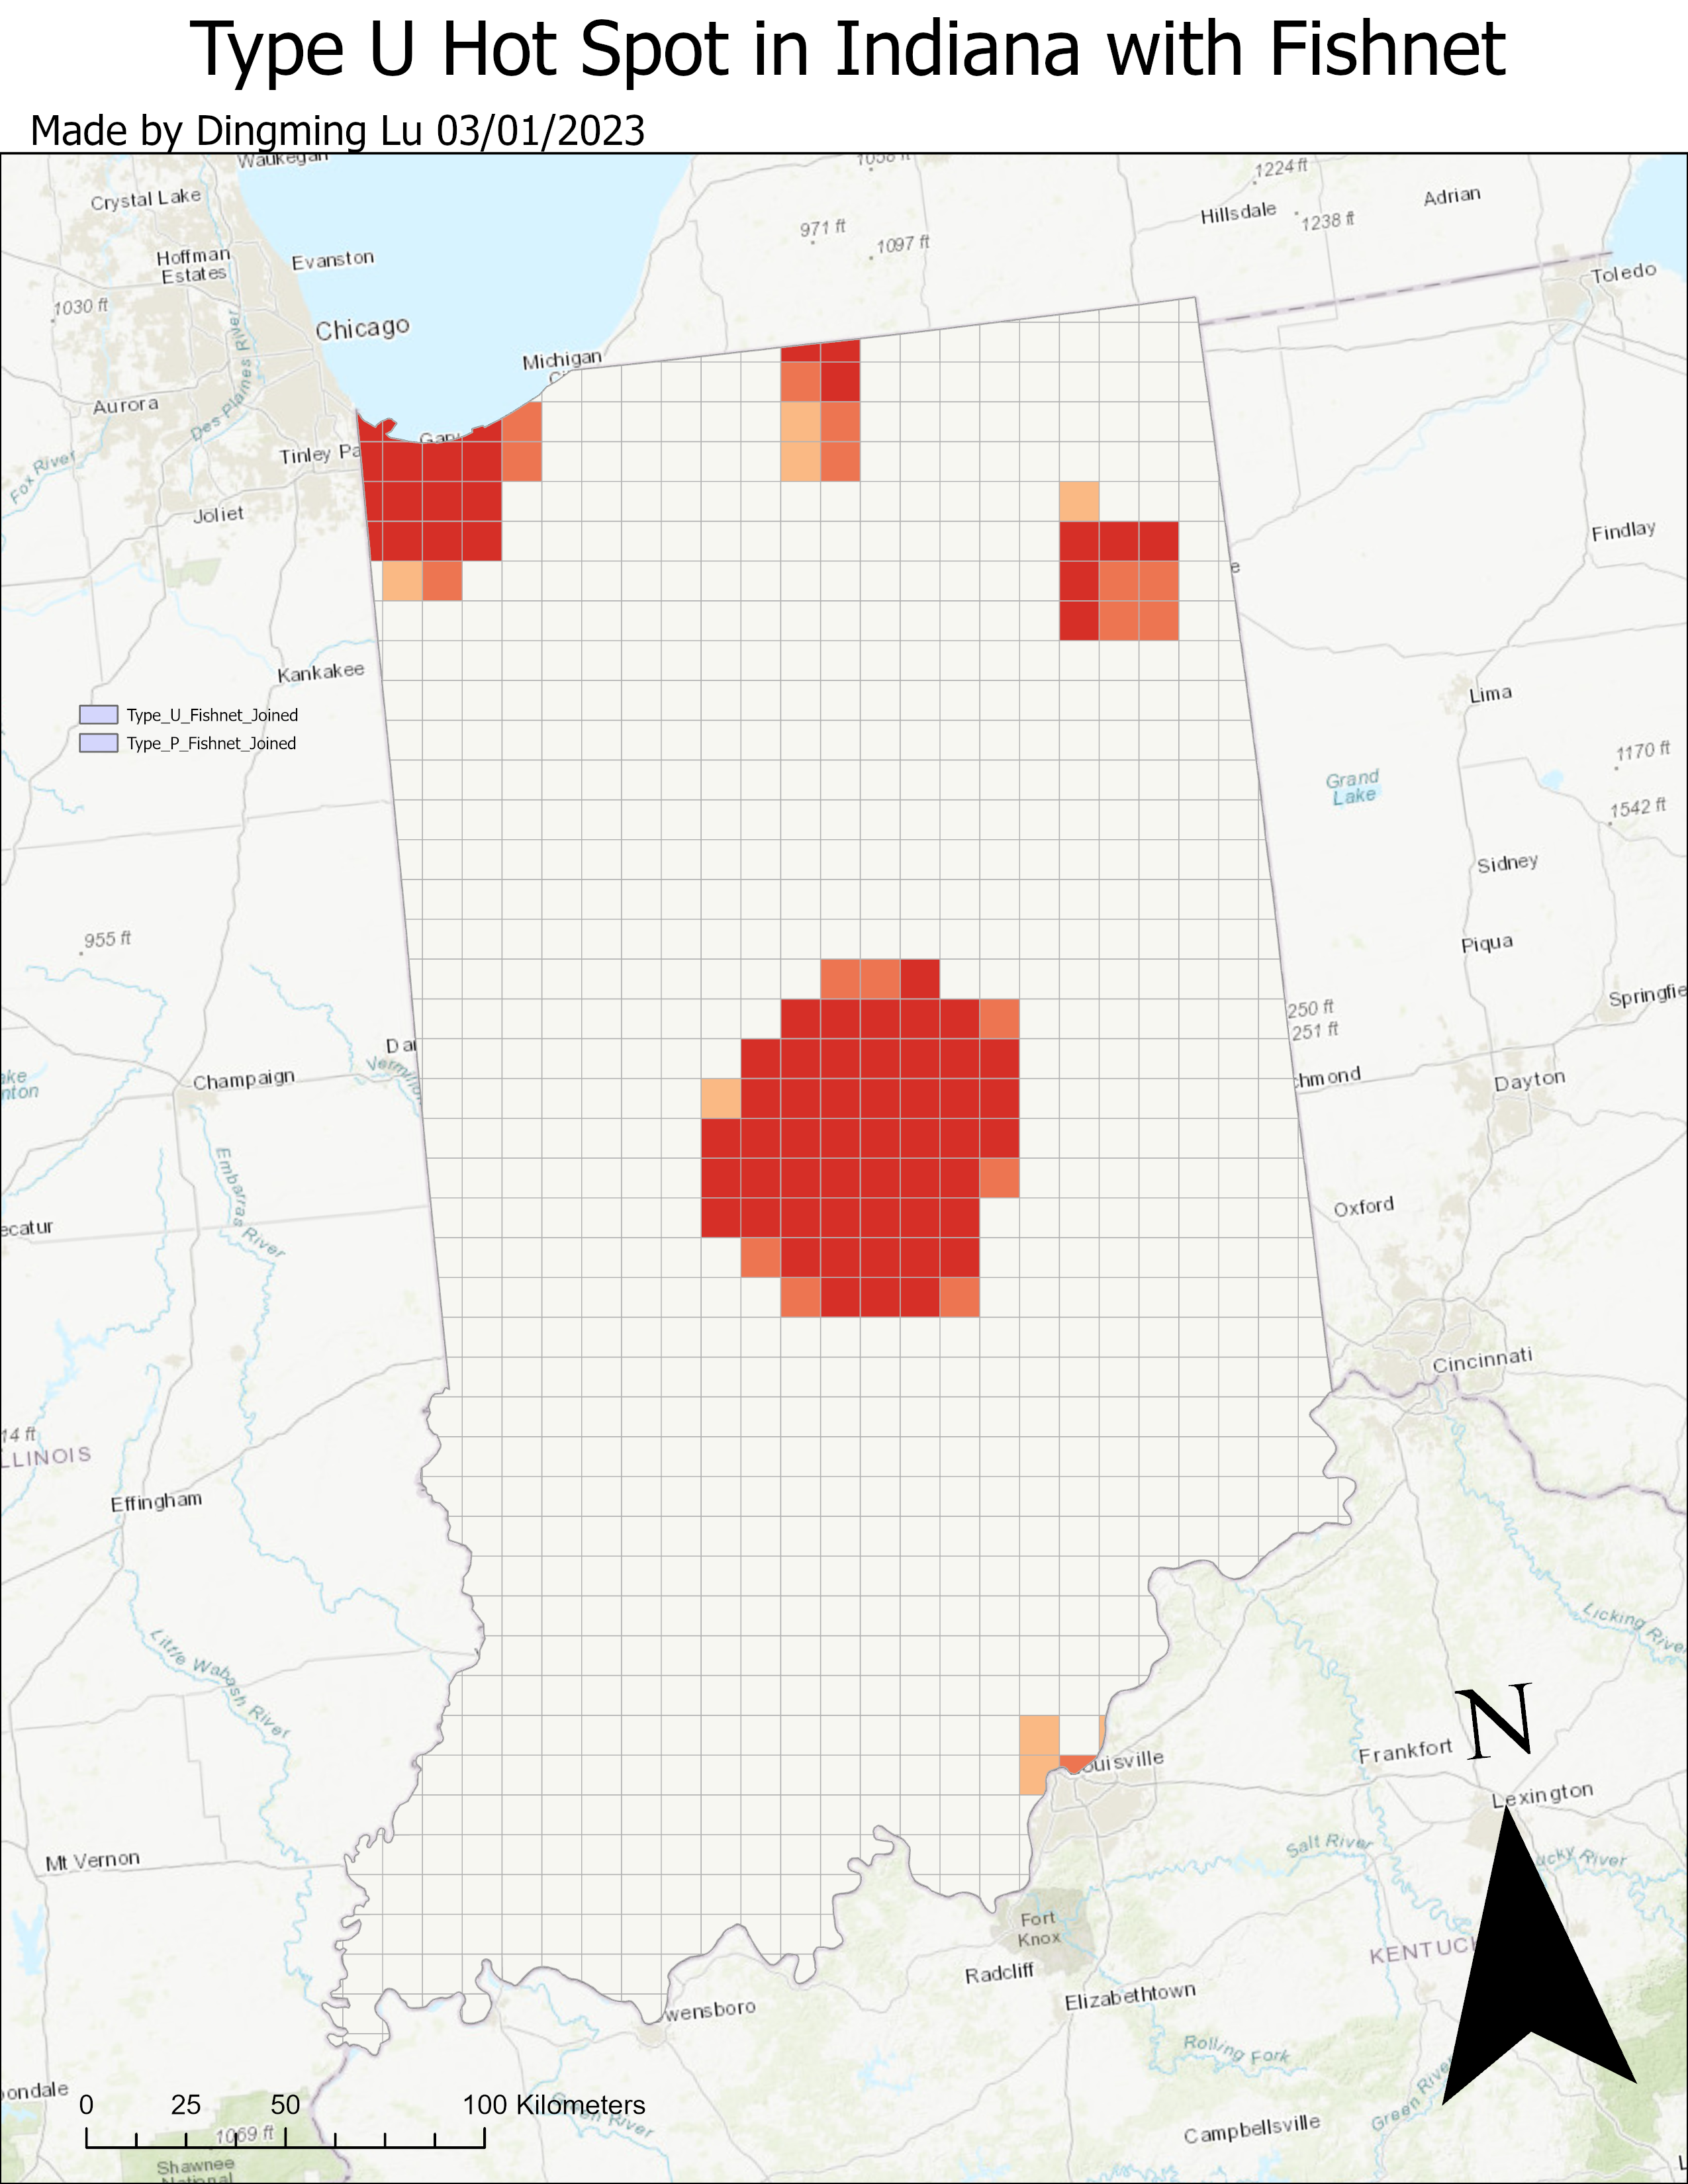
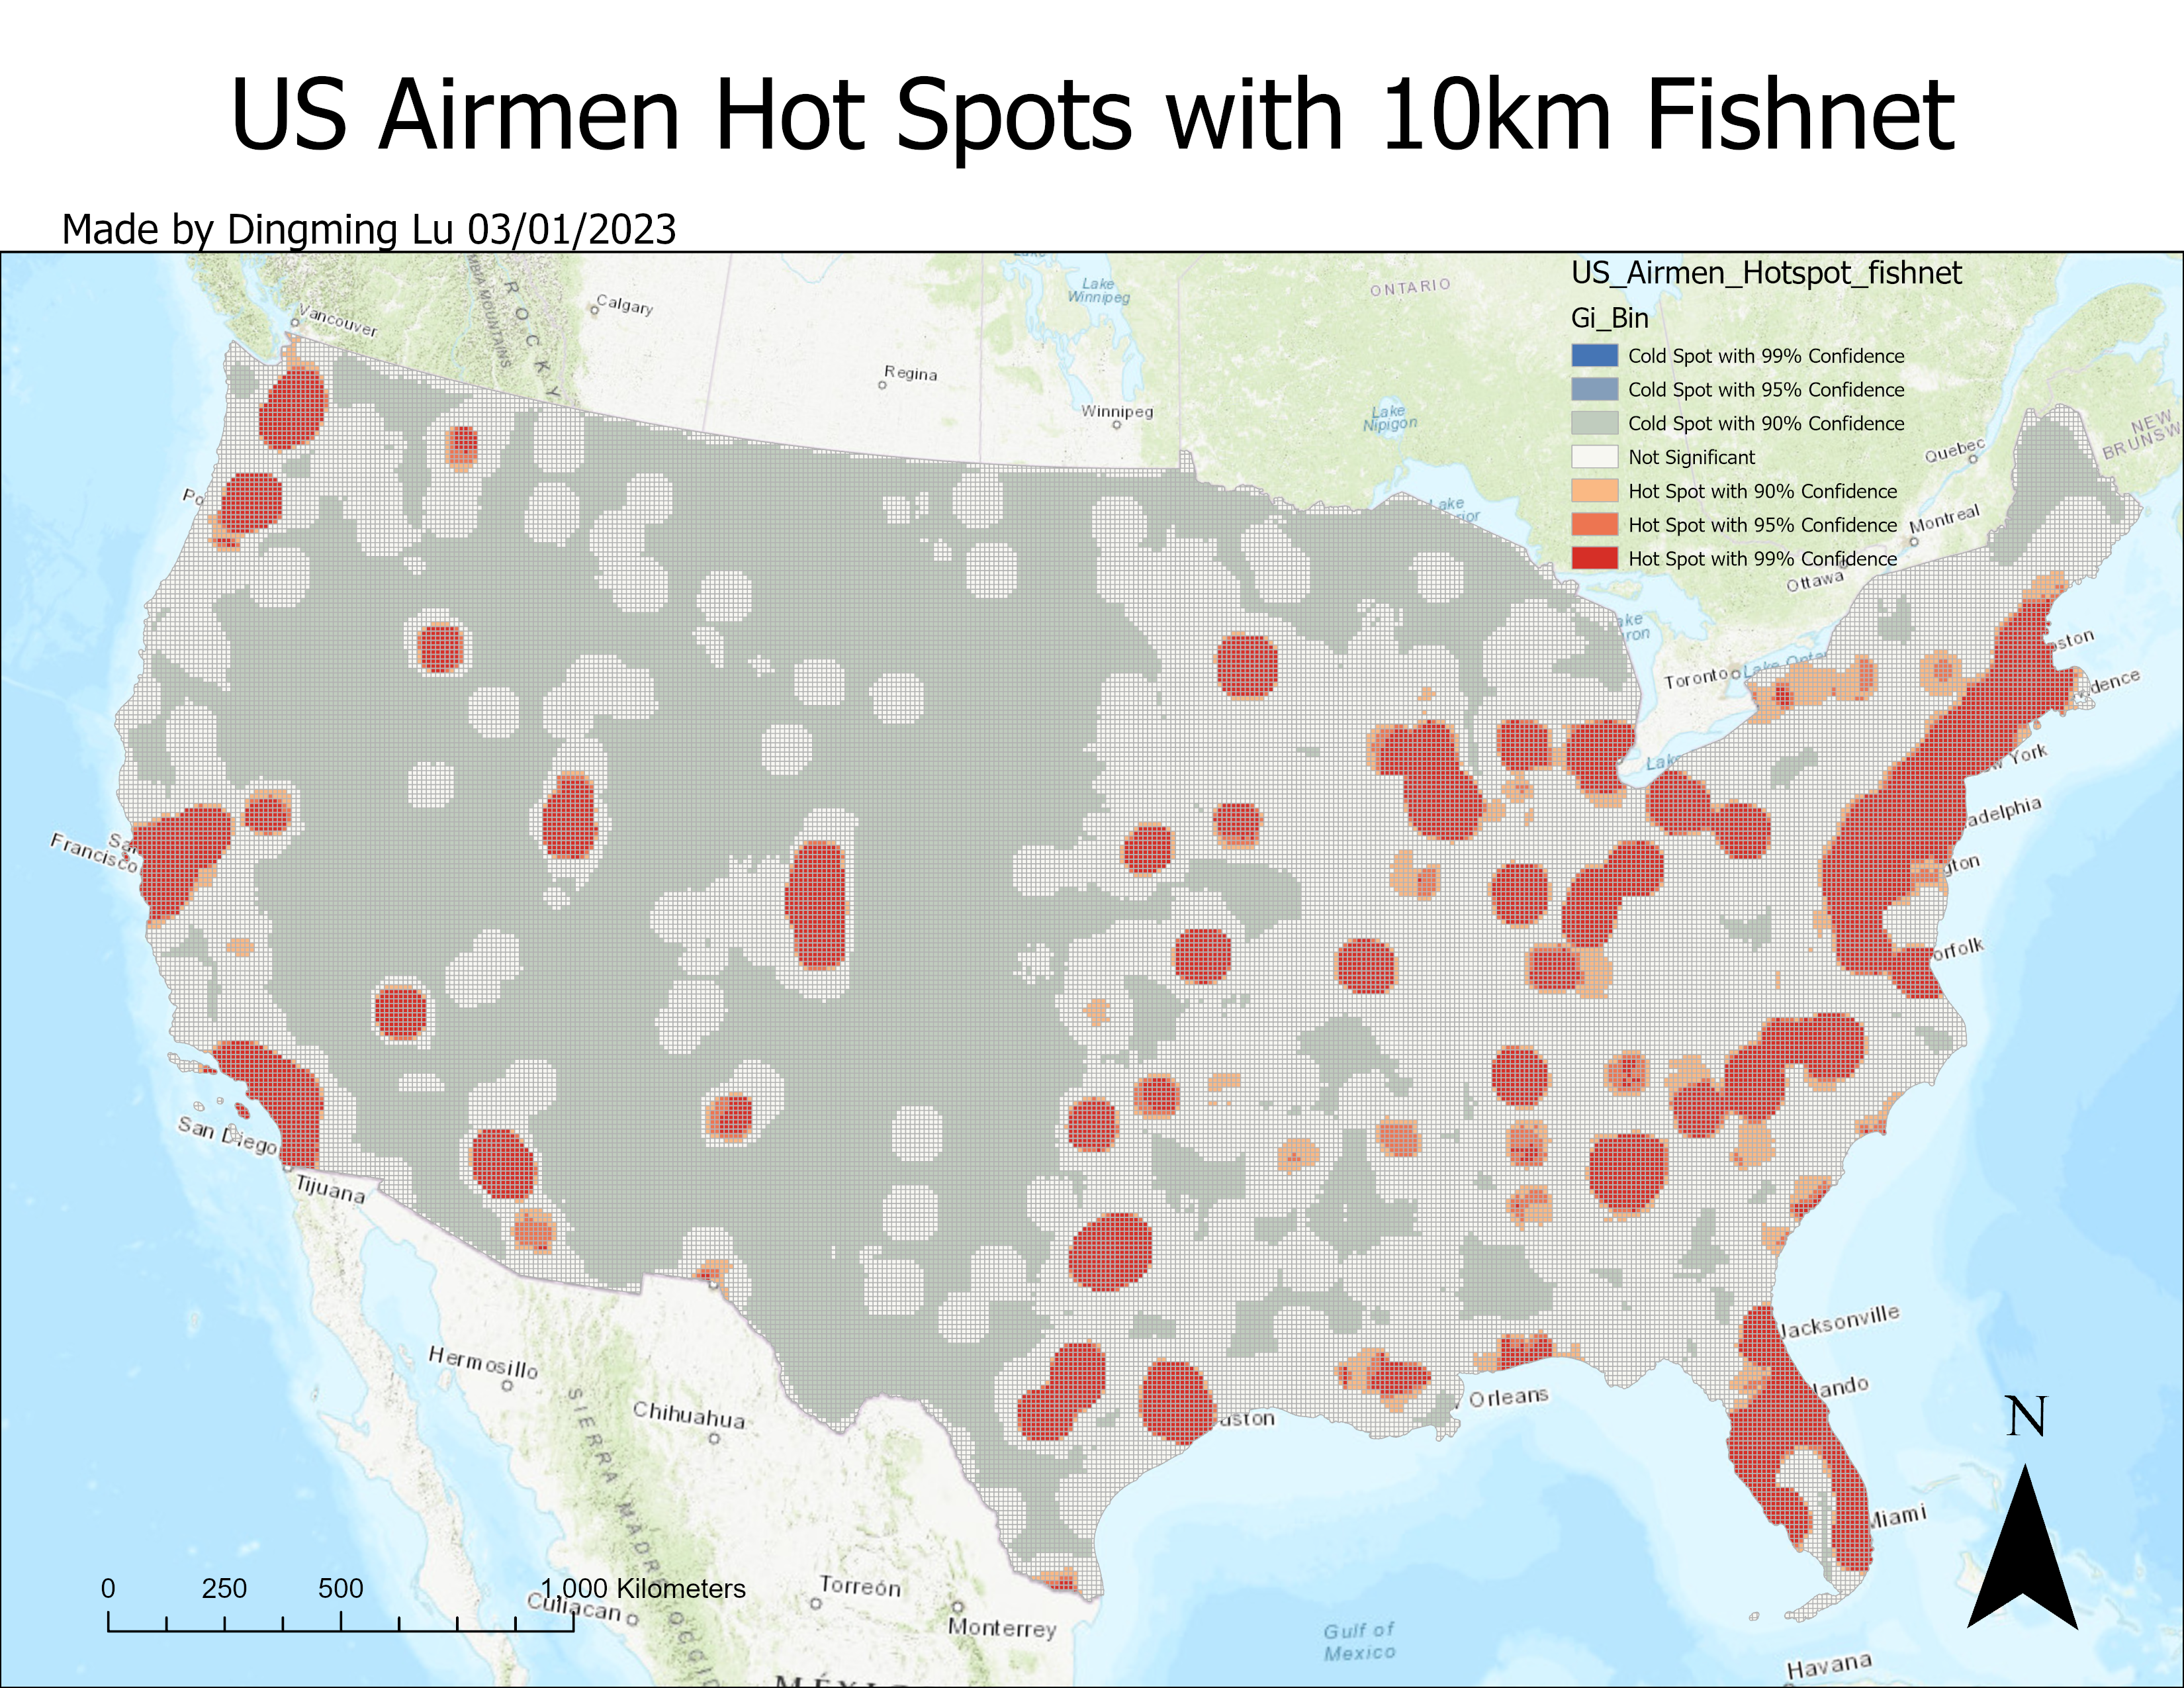
Fishnet: The hot spots focus on the area near Indianapolis, south of Chicago, and some part of northeast ofIndiana. It has higher resolution.
Zipcode: The hot spots focus on the area near Indianapolis and northwest corner of Indiana. It has higher resolution than county but lower resolution than fishnet.
Fishnet did the best job because it performs the area that is not shown in other frames in a higher resolution.
County did the worst job because it performs least area compared to other frames.
