I. Intro
Date: 02/22/2023
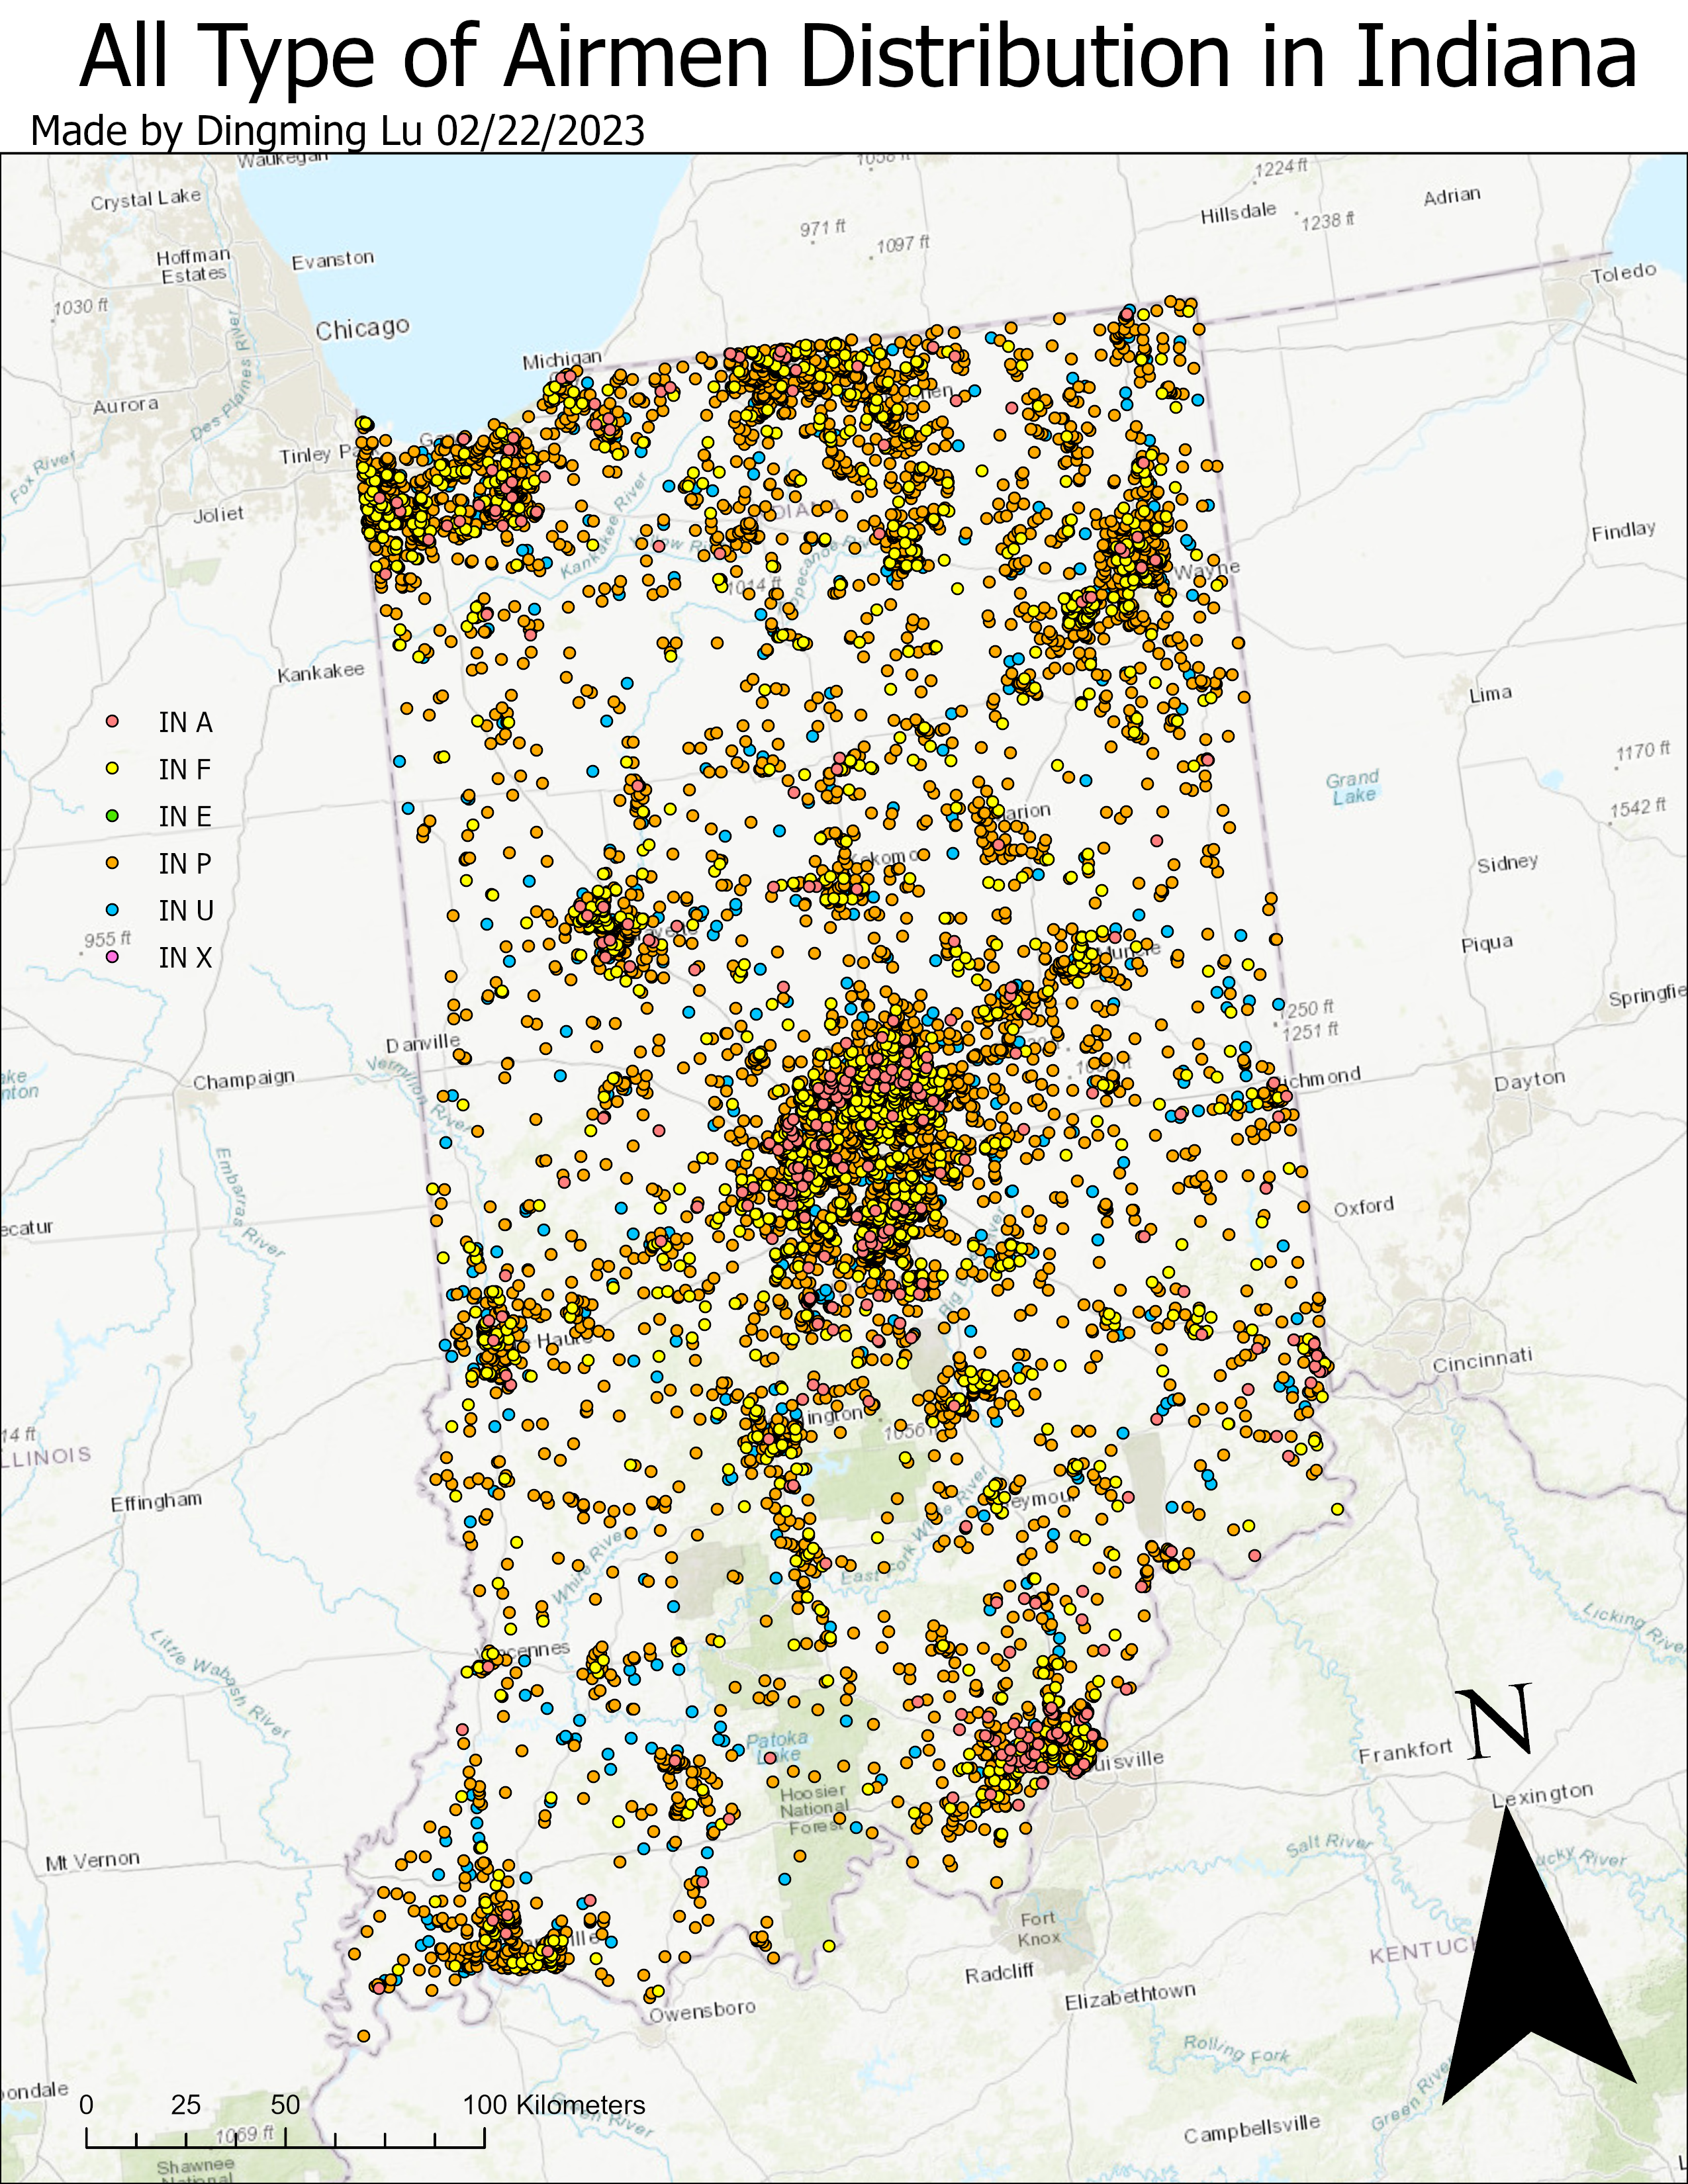
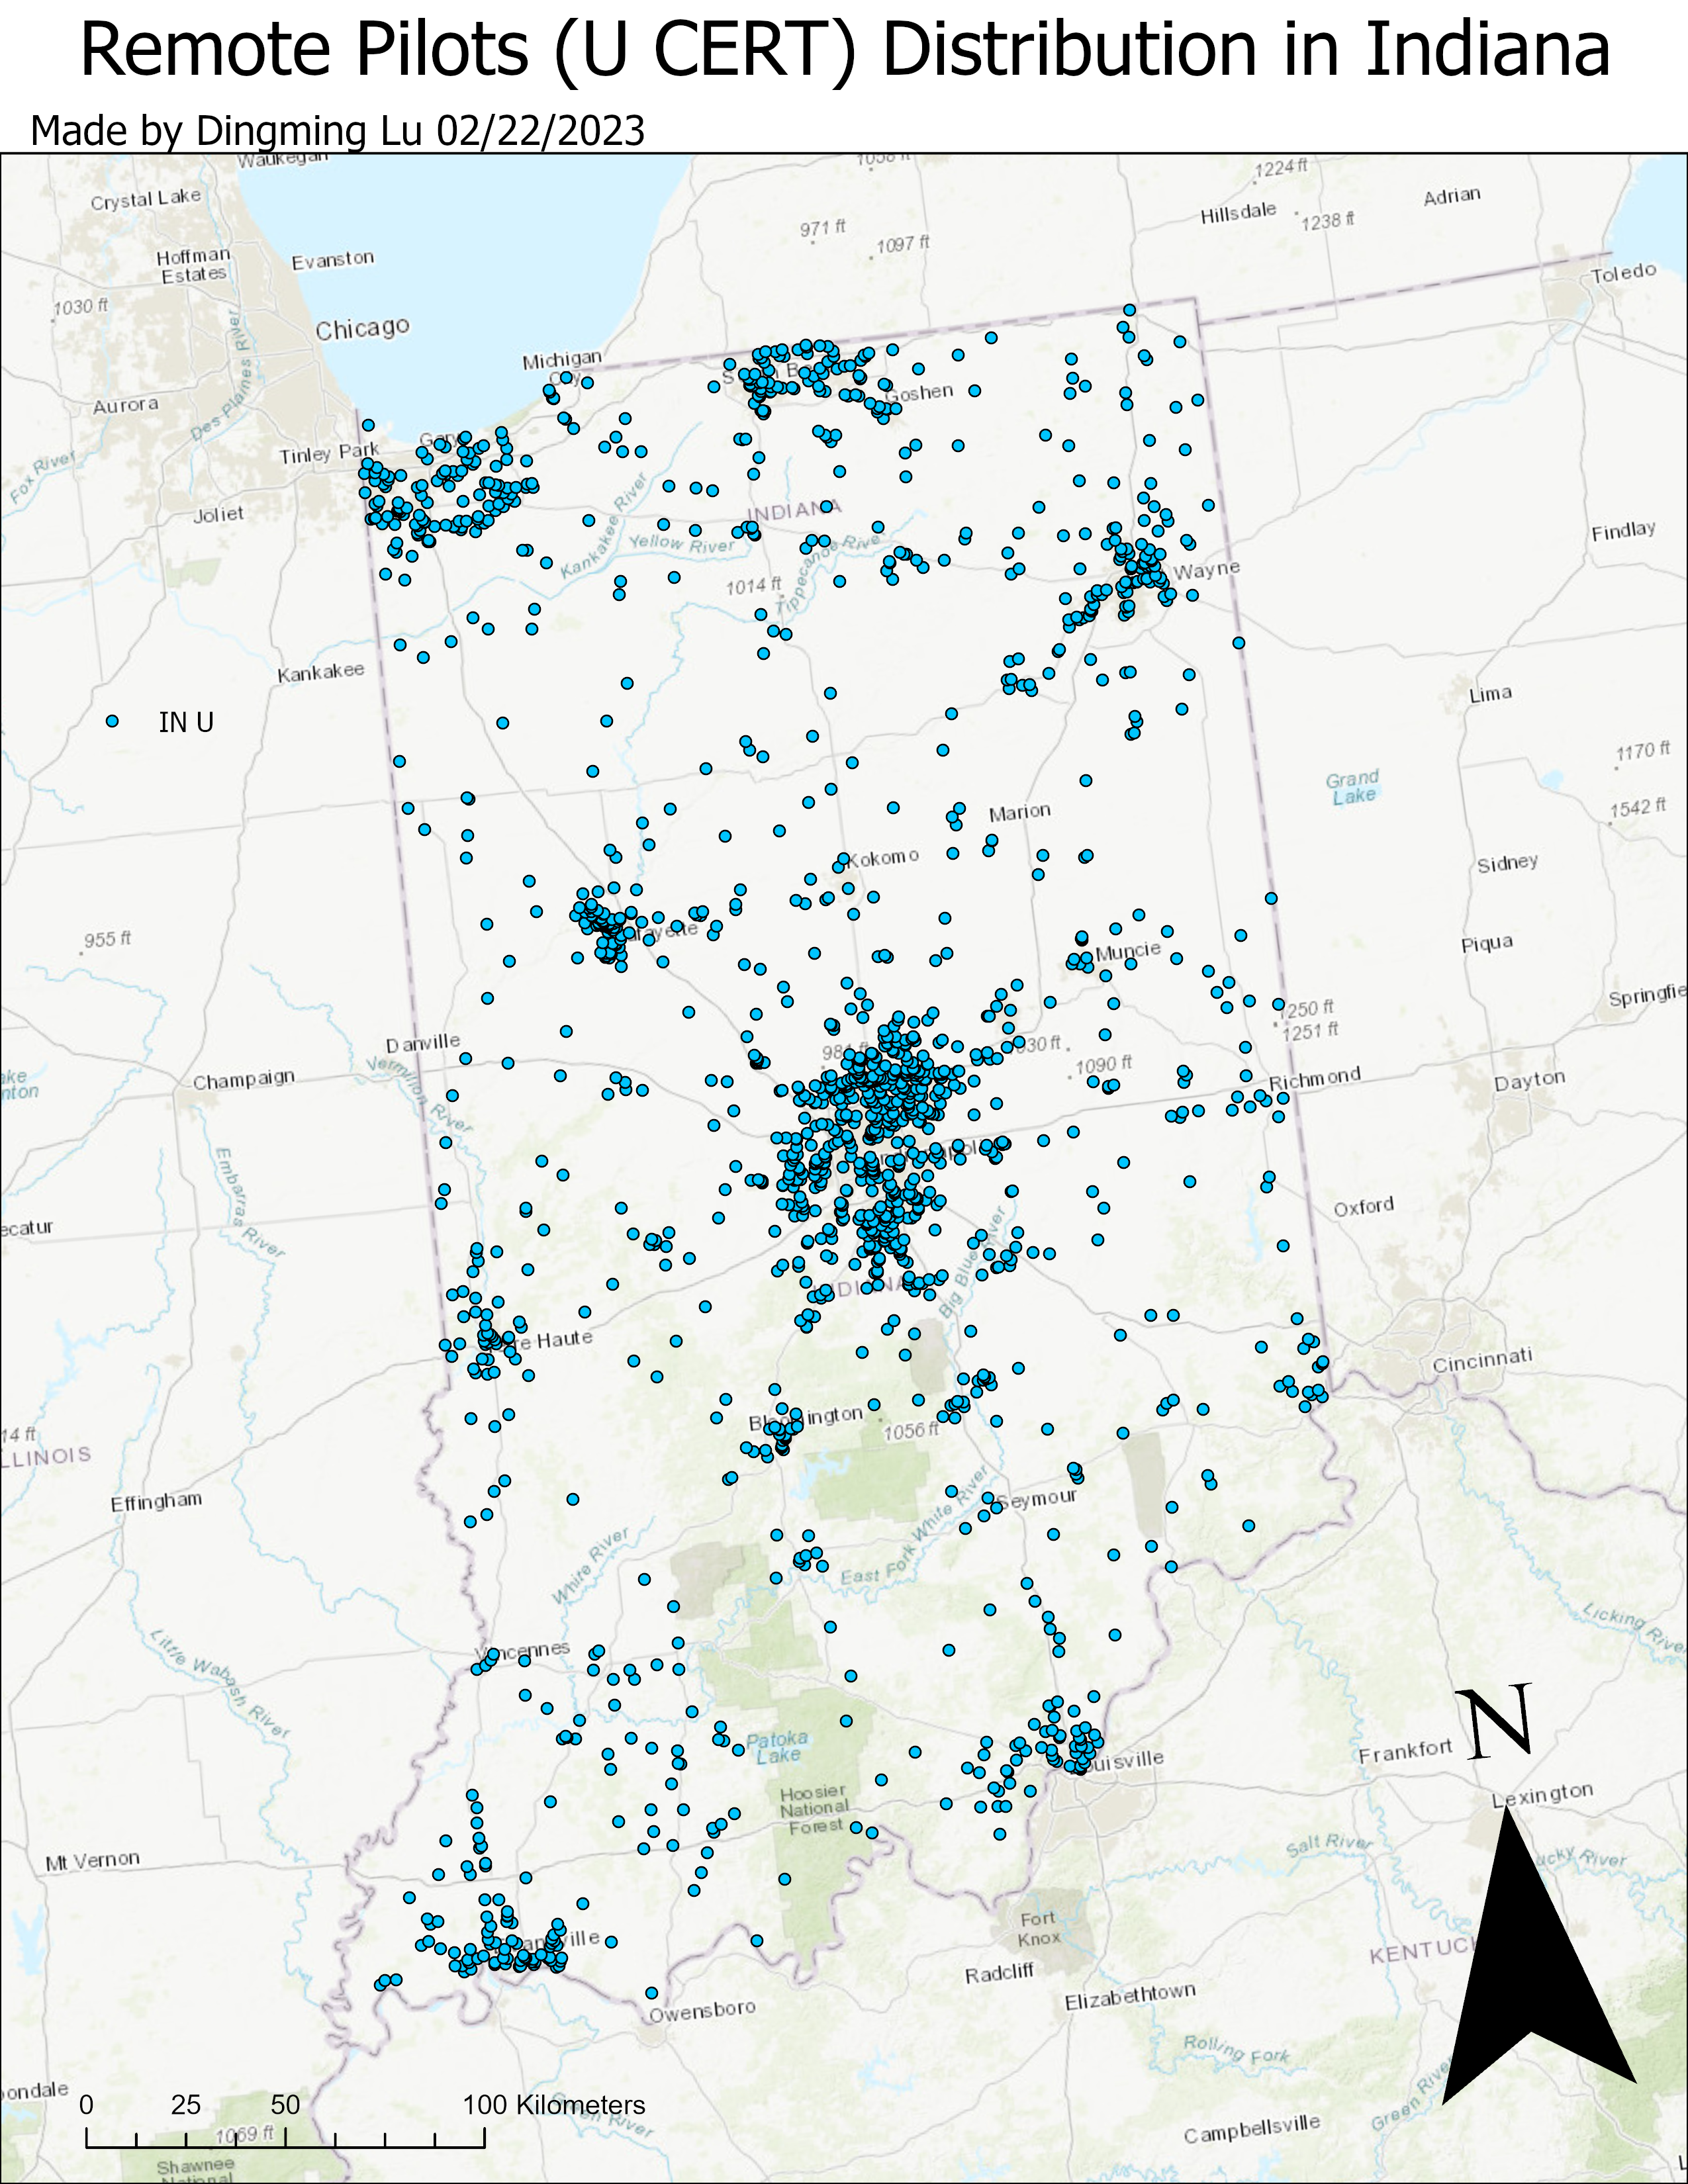
During the first lab, we worked with joined tables and generate new feature classes with attribute based queries.
II. Unify Projection
Projection of each feature:
- Airmen_pts_cont_us: WGS 1984
- Fishnet_10km_cont_us: North America Lambert Conformal Conic
- Us_zipcode_cont: NAD 1983
- Continental_us_counties_lambert: North America Lambert Conformal Conic
Under the analysis ribbon, click tools, and search project. Project data to North America Lambert Conformal Conic.
III. Table Join
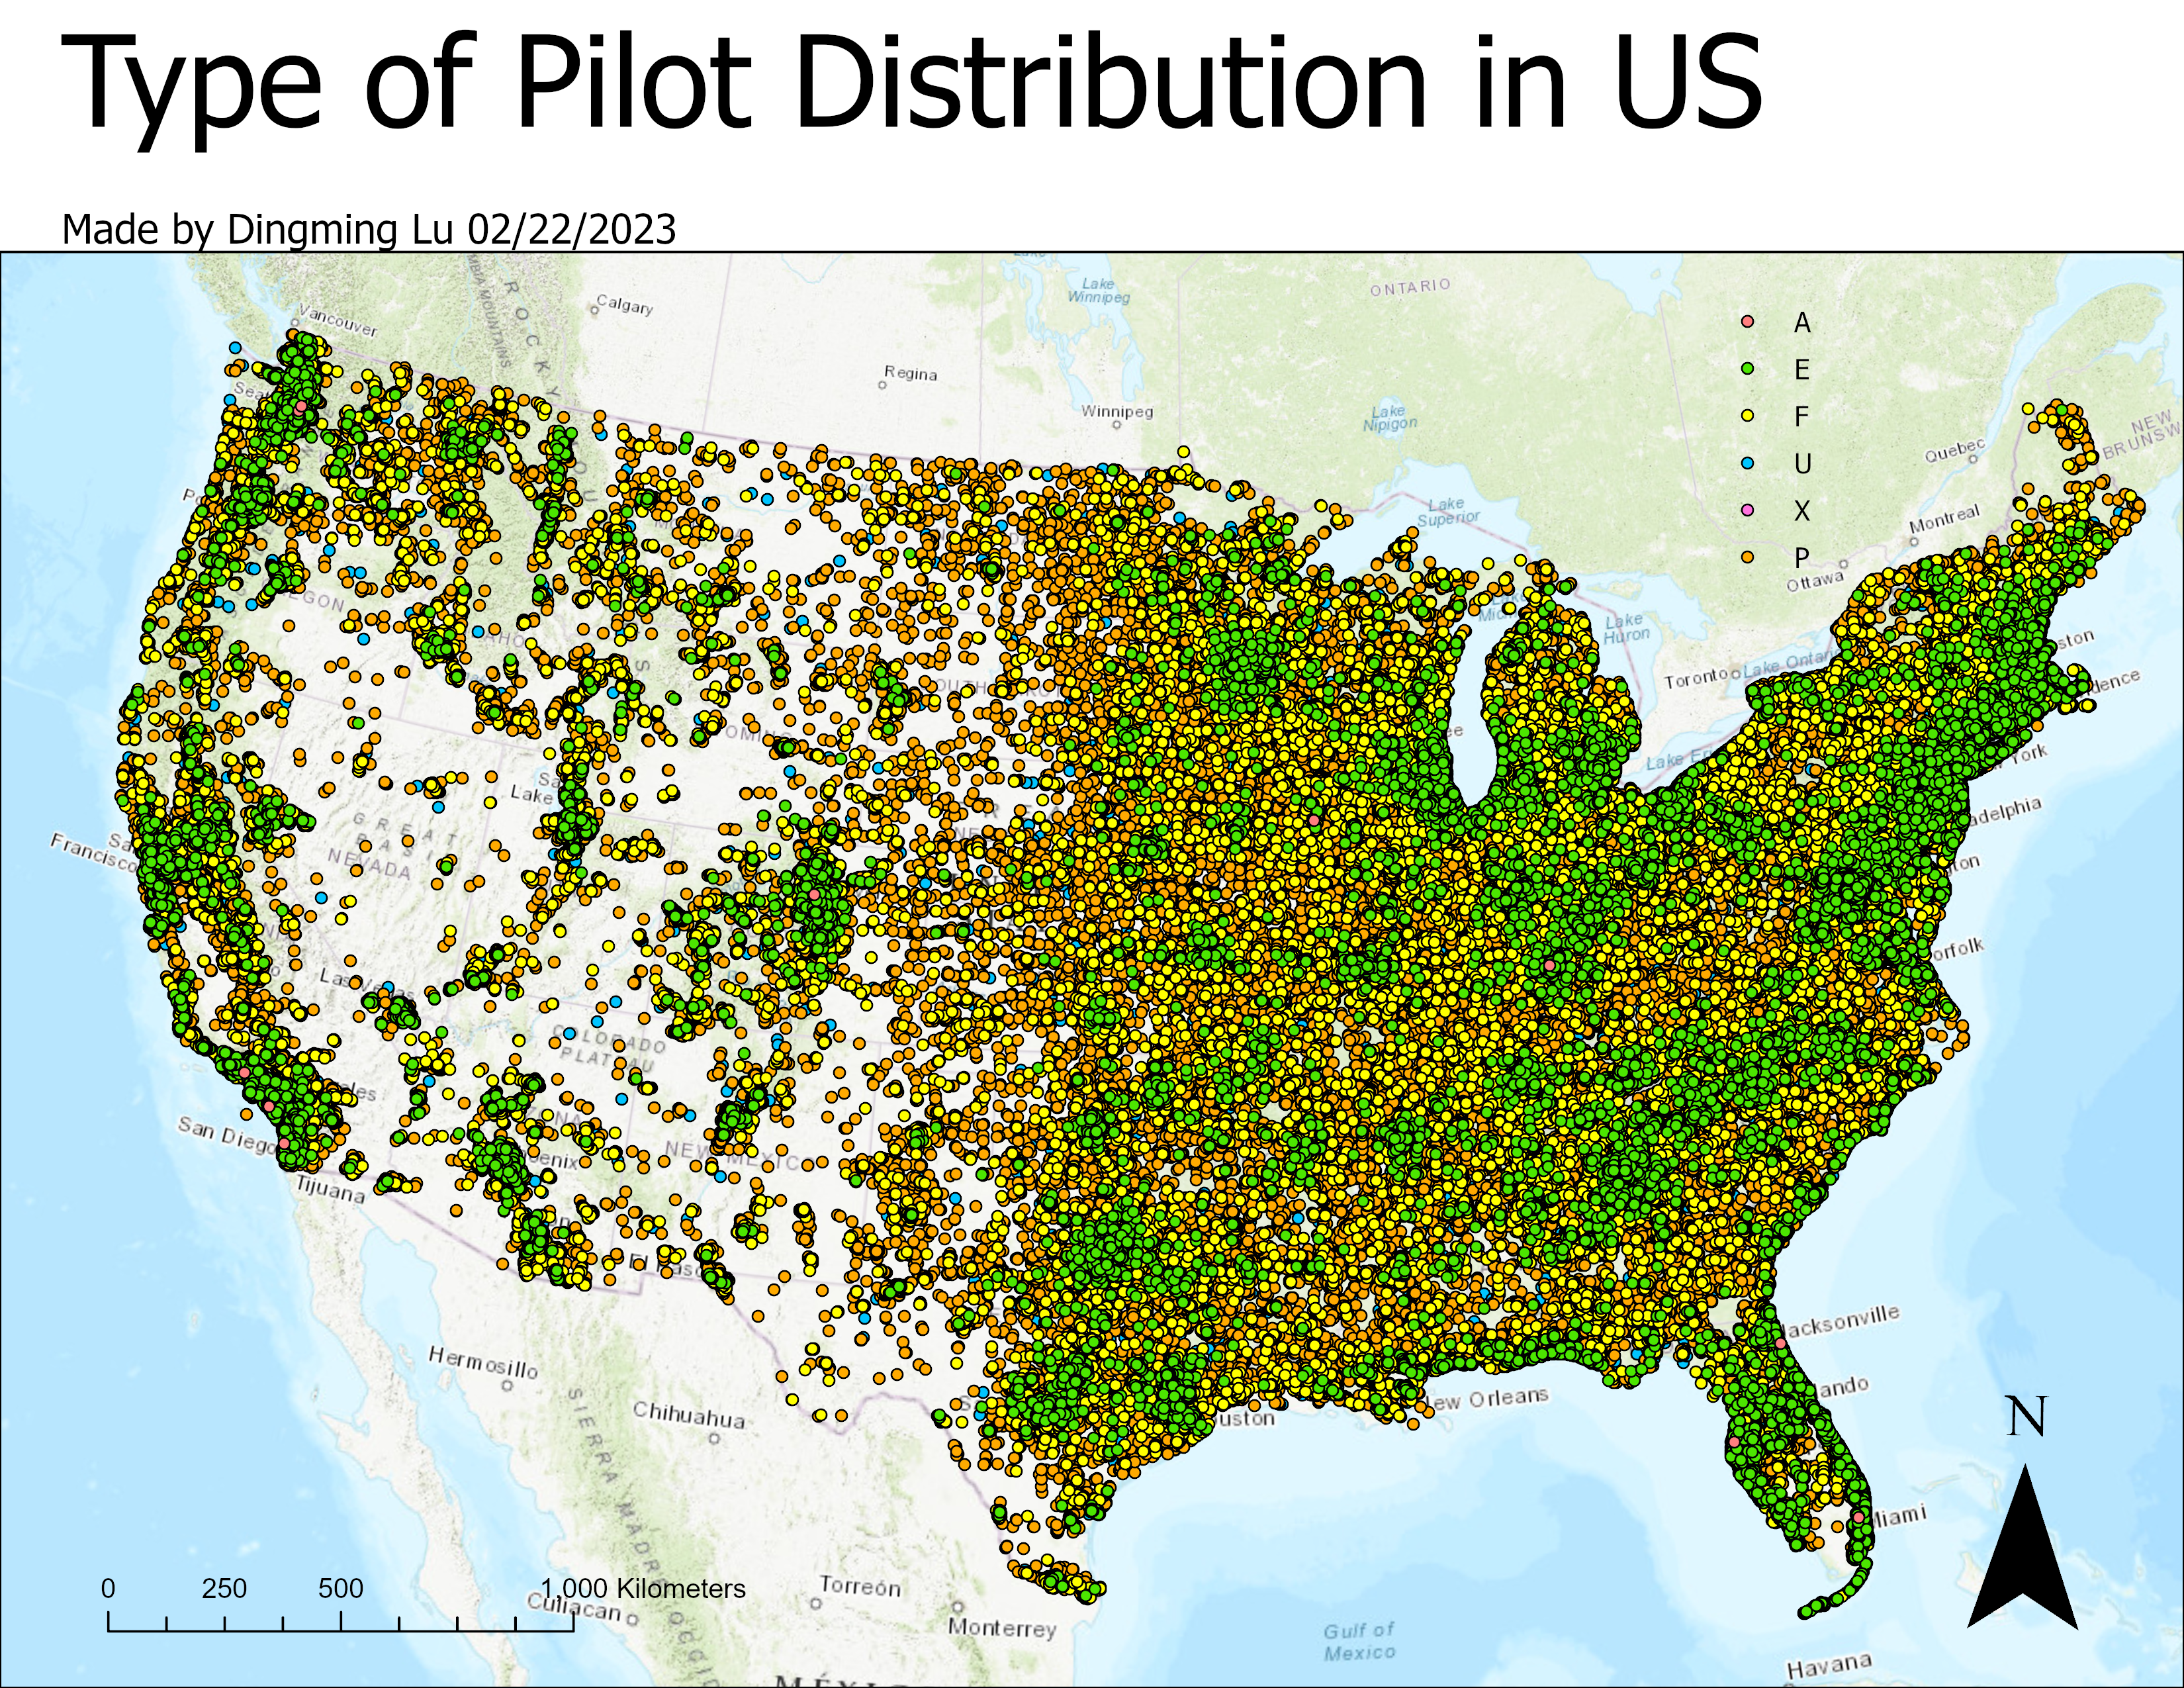
Airmen points feature and PILOT_CERT table will be joined via UNIQUE_ID field, so they will match based on the unique ID.
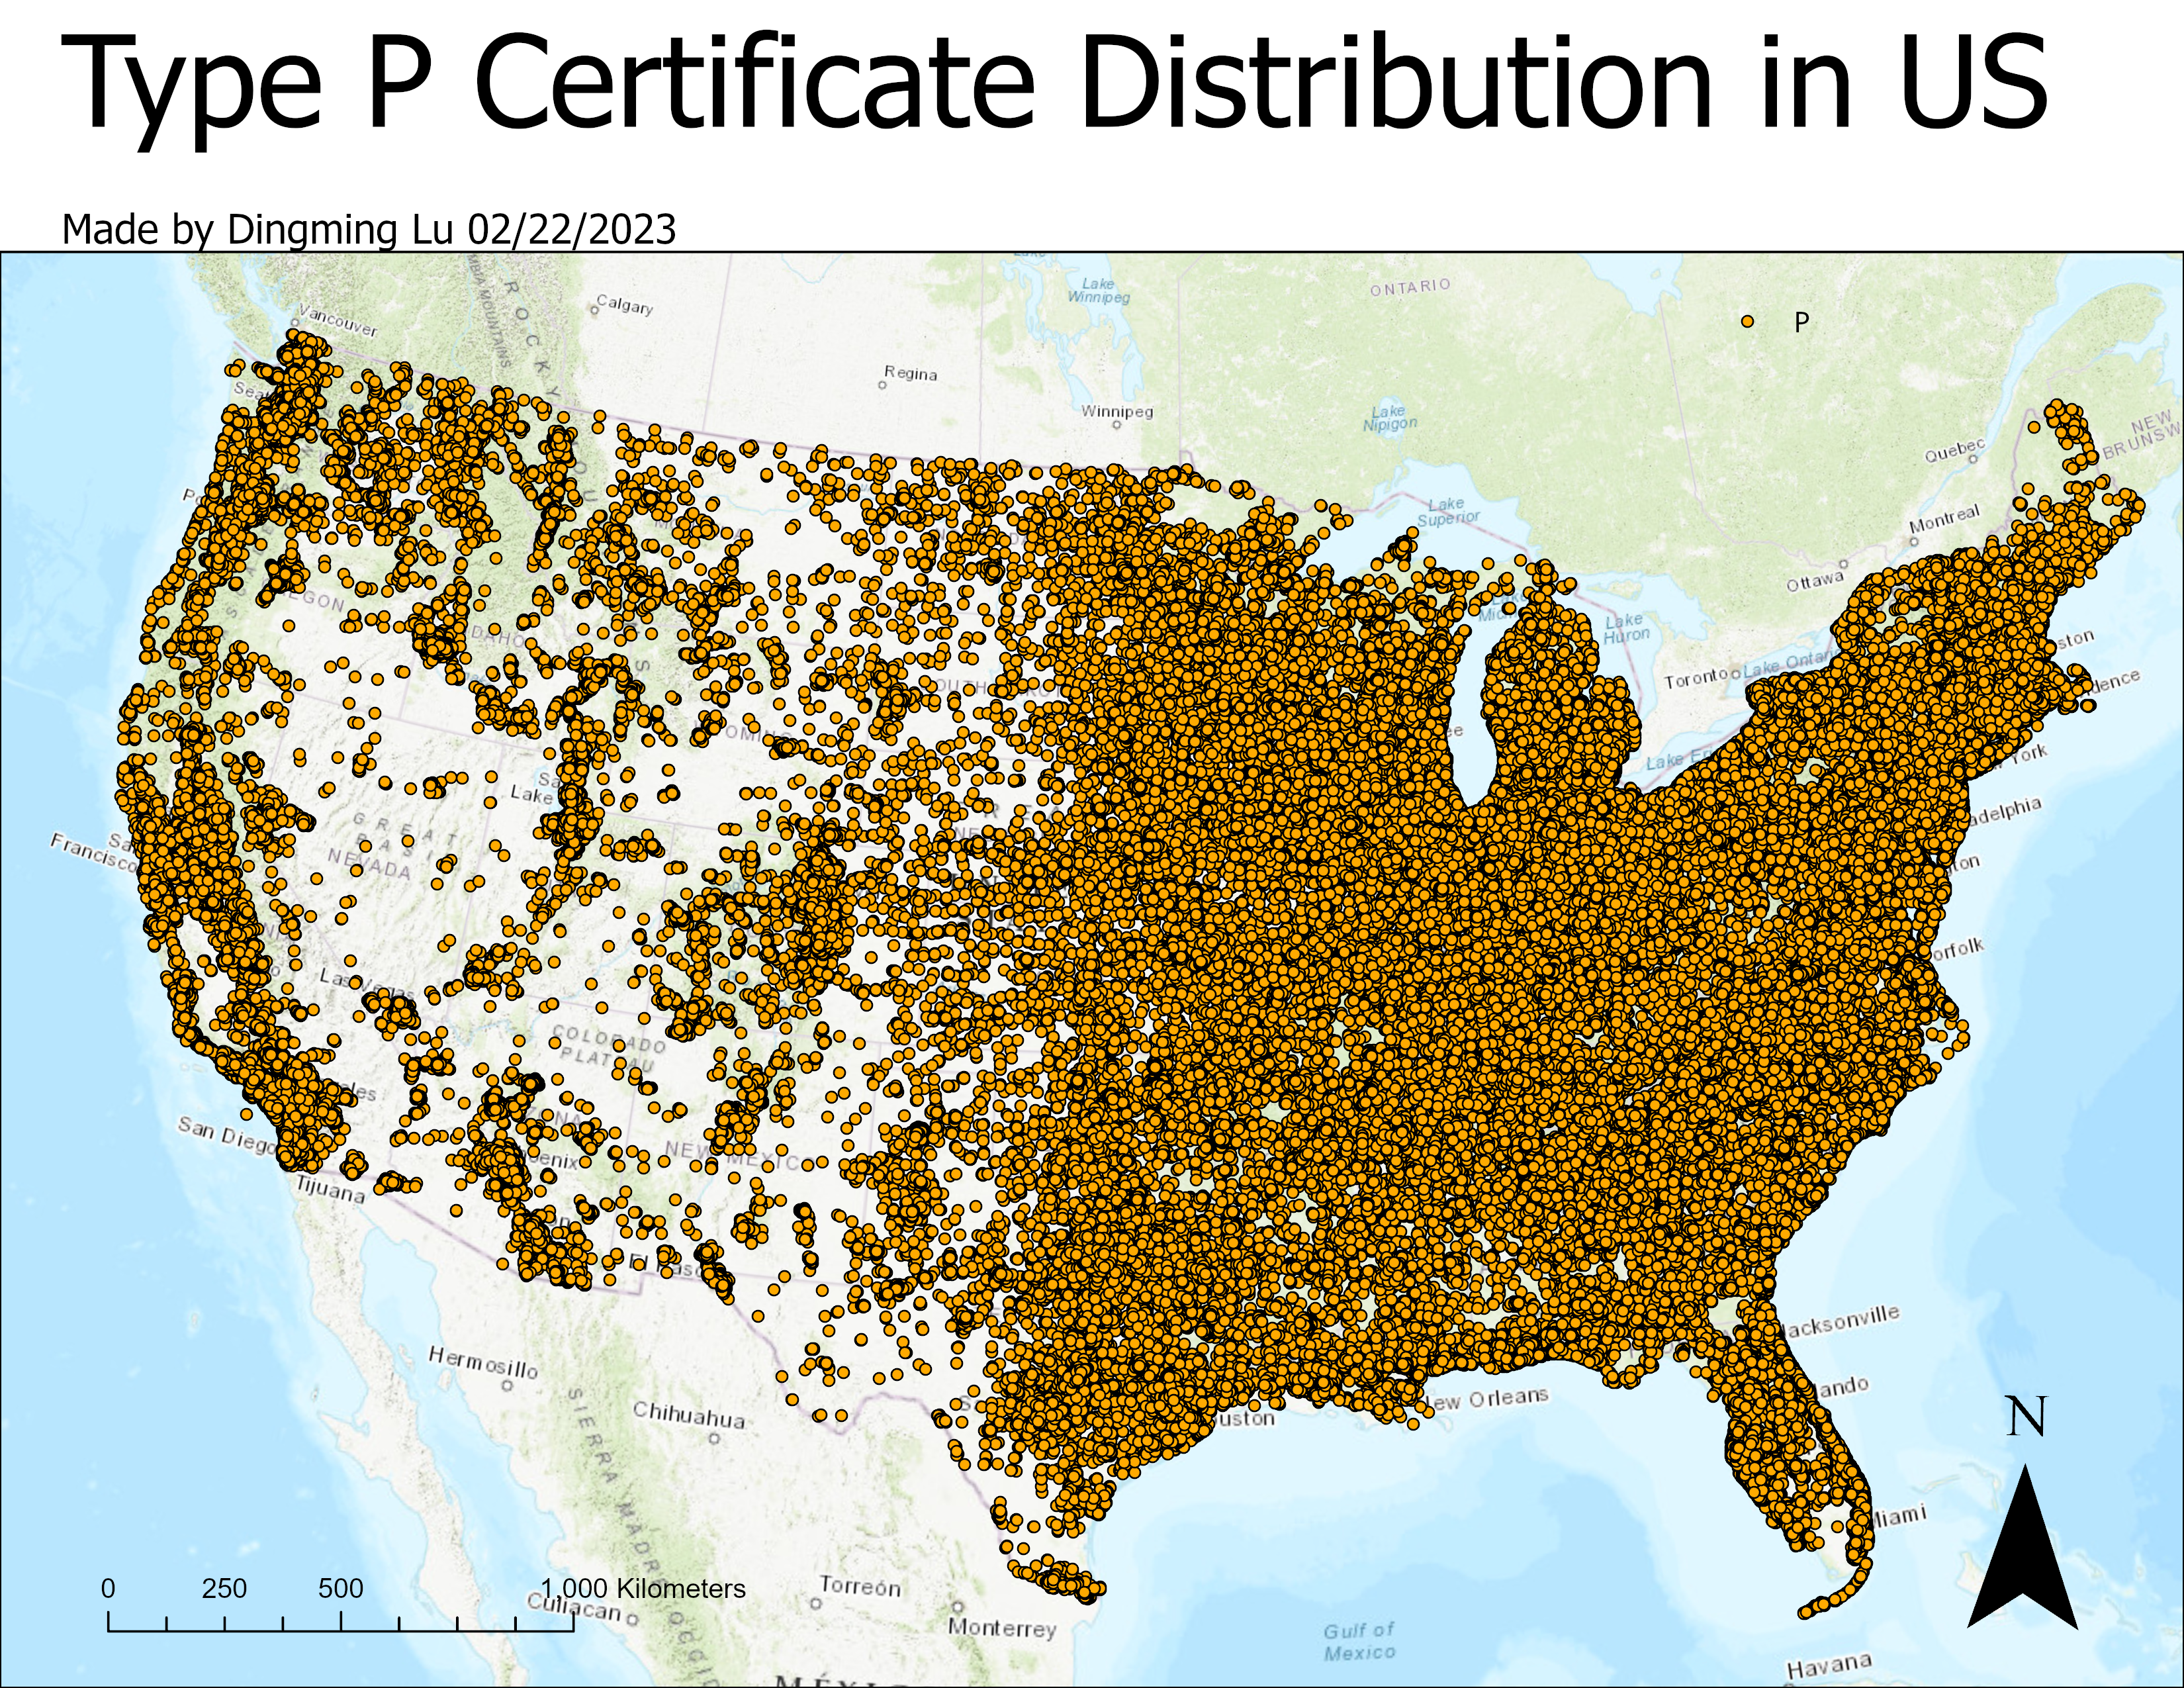
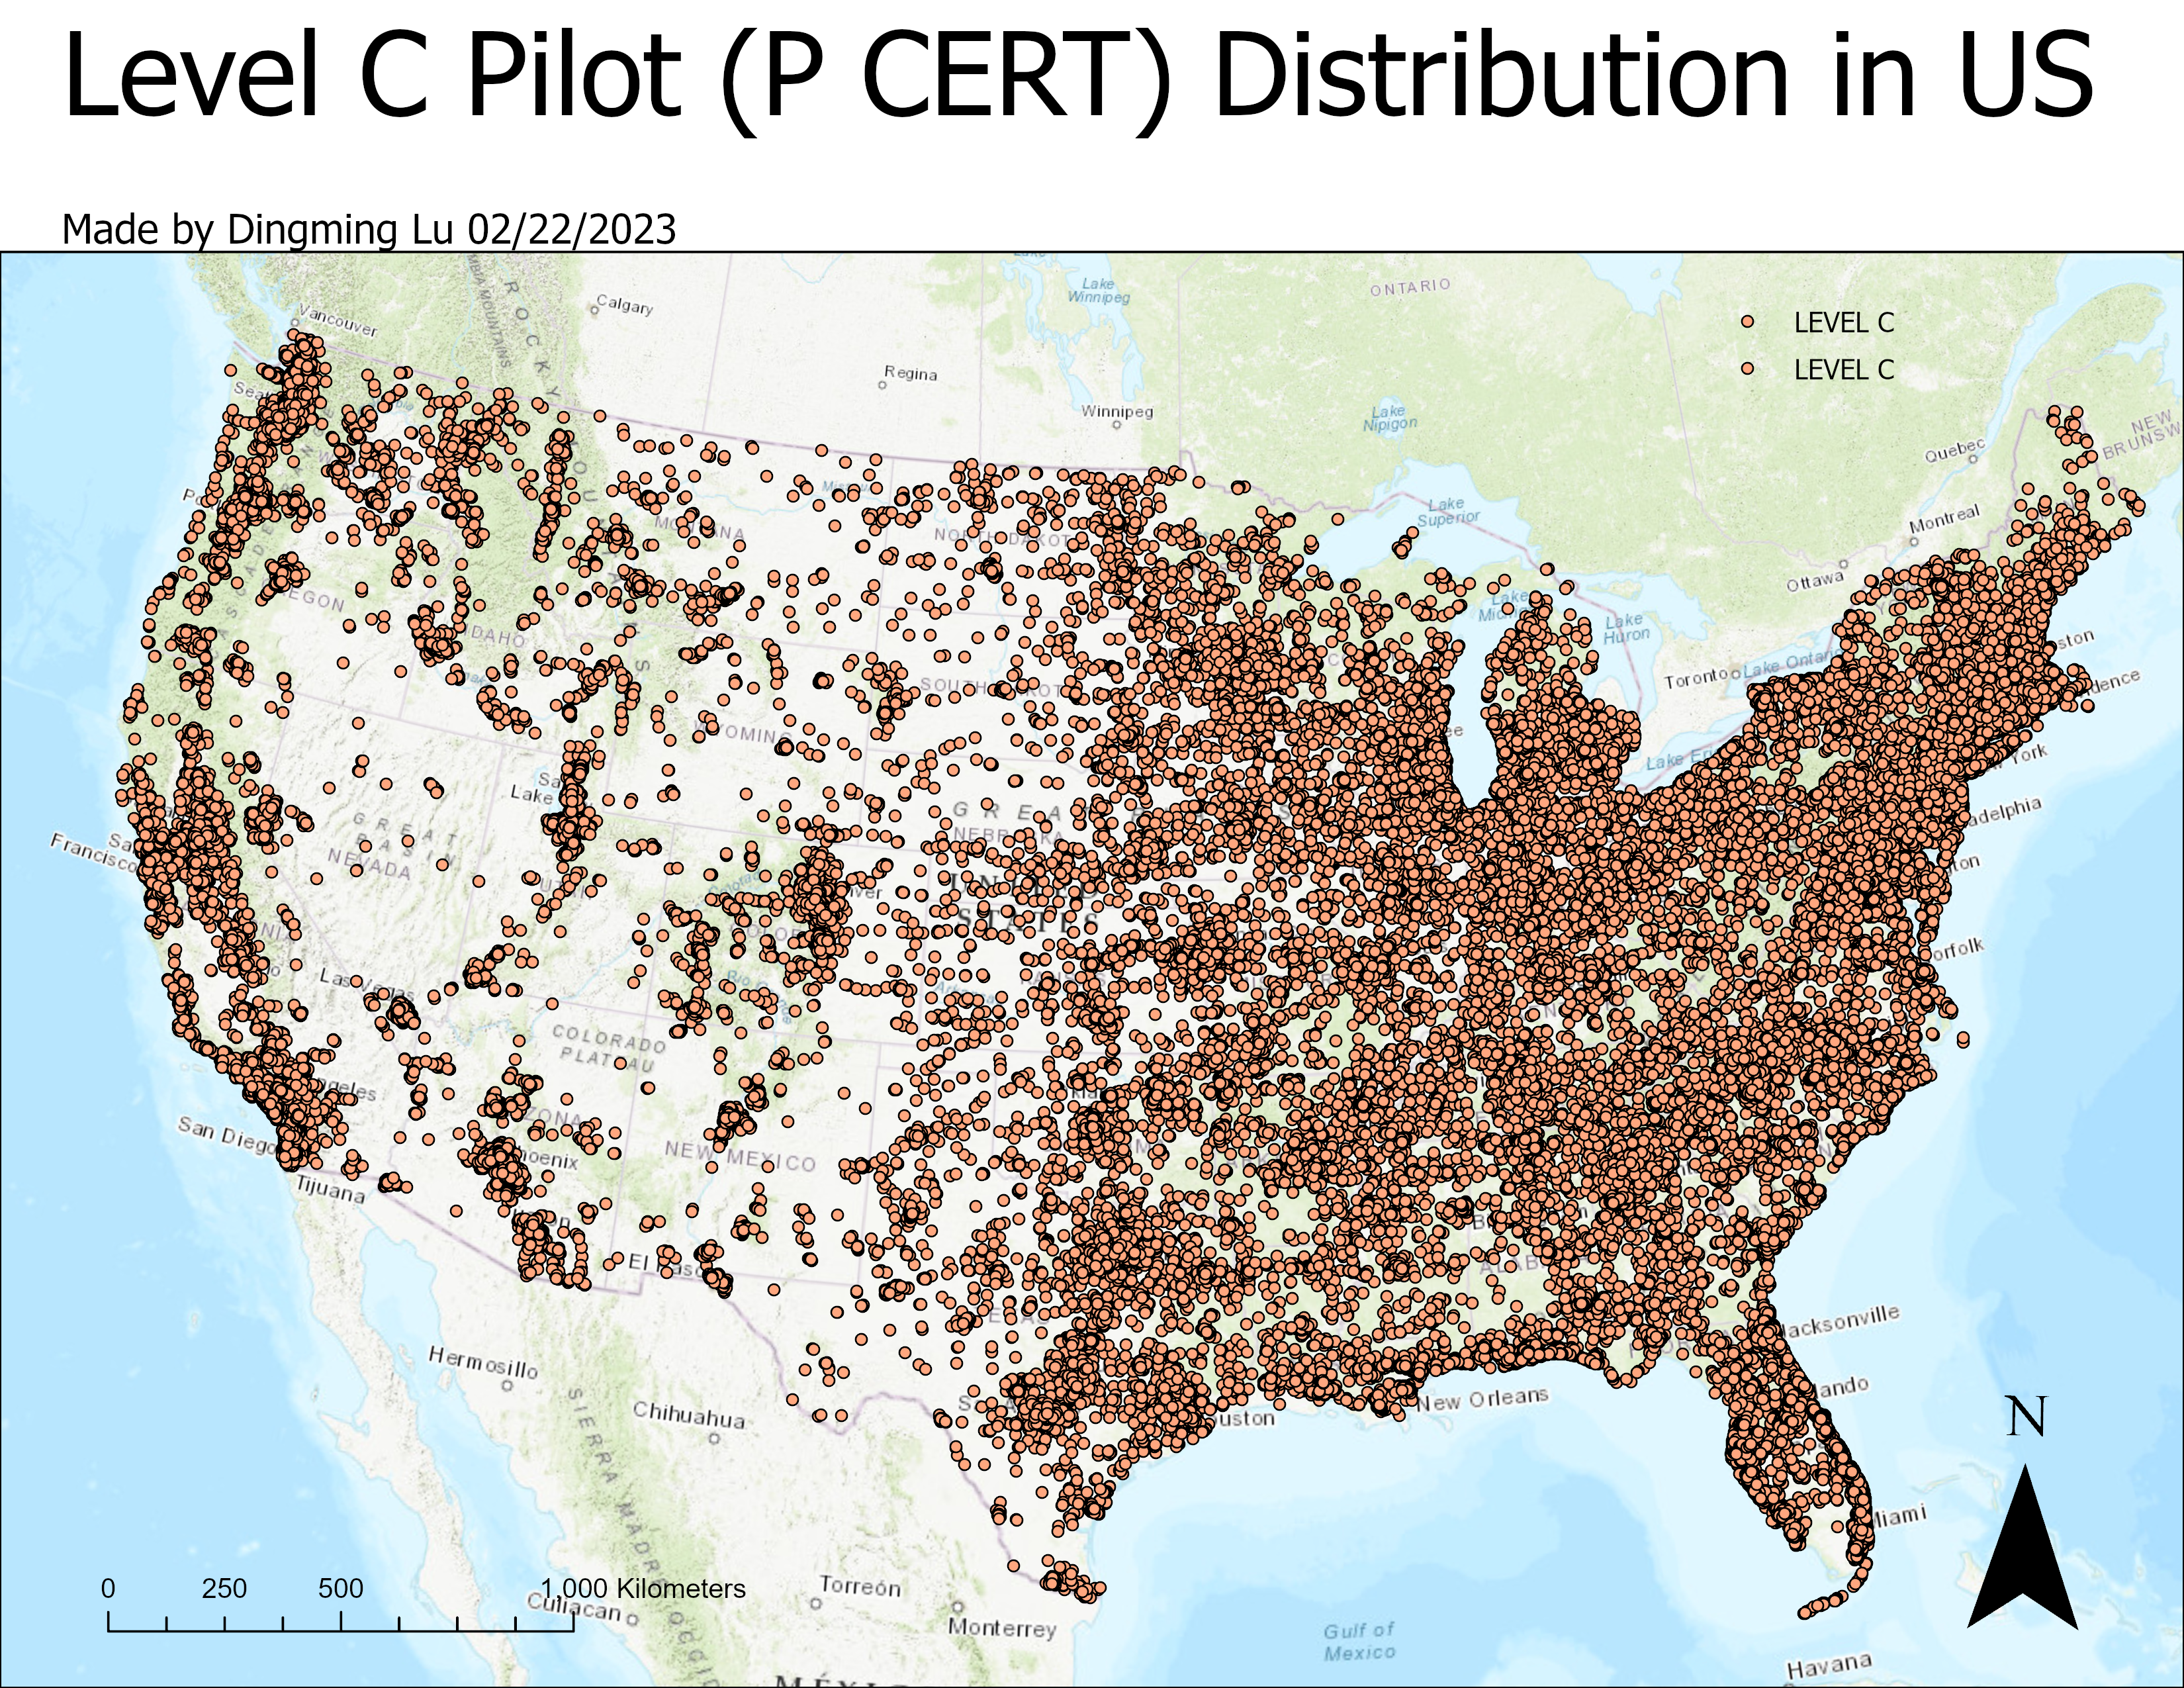
- P: pilot
- A: Airline transport pilot
- C: Commercial Pilot
- P: Private pilot
- V: Recreational pilot
- T: Sport pilot
- S: Student pilot
- F: Flights instructor
- A: authorized aircraft instructor
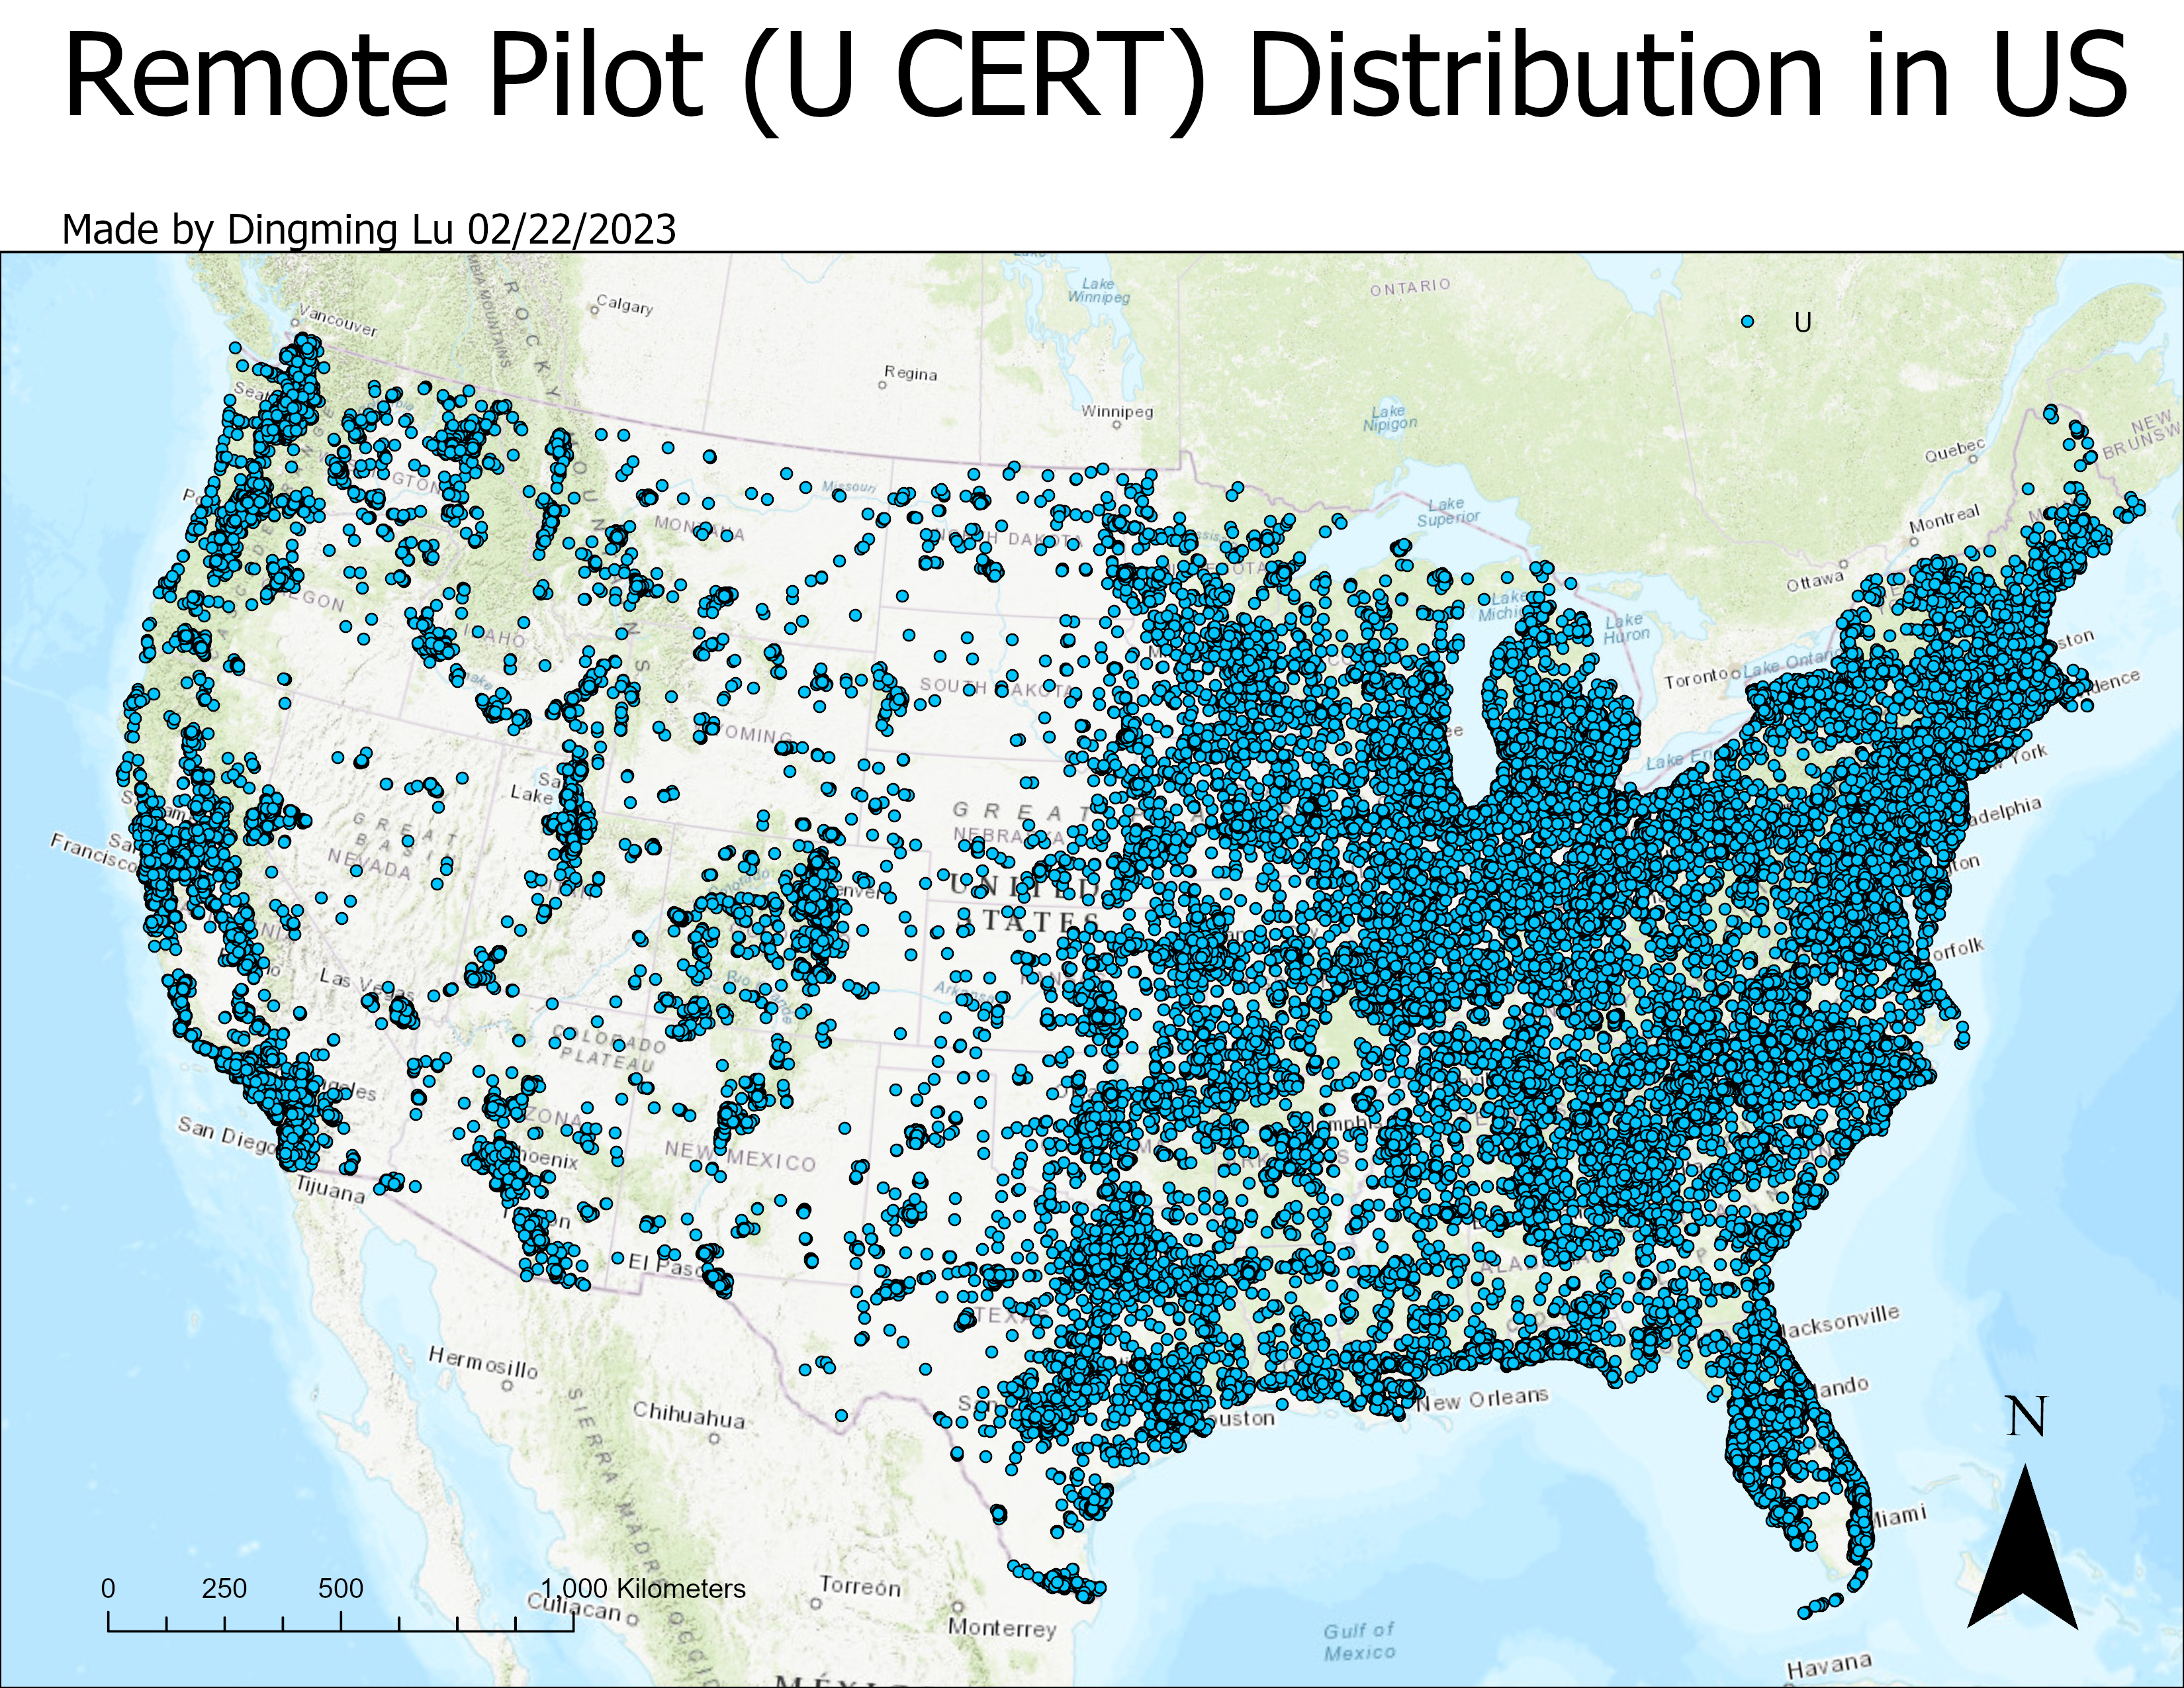
- U: Remote pilot
- G: ground instructor
- E: Flight engineer
- H: flight engineer (special purpose-lessee)
- X: flight engineer (foreign based)
- M: mechanic
- T: control tower operator
- R: repairman
- I: repairman experimental acft builder
- L: repairman flight sport aircraft
- W: parachute rigger
- D: dispatcher
- N: flight navigator
- J: flight navigator (special purpose-lessee)
