Course Project: AT319 Lab 05 Spatial Analysis with Volleyball Teams

I. Intro

Date: 02/15/2023

During the first lab, we did the spatial analysis of the United States volleyball champaign teams.  

II. Input Data

Each recruit is geocoded and put onto the base map with the arenas. 
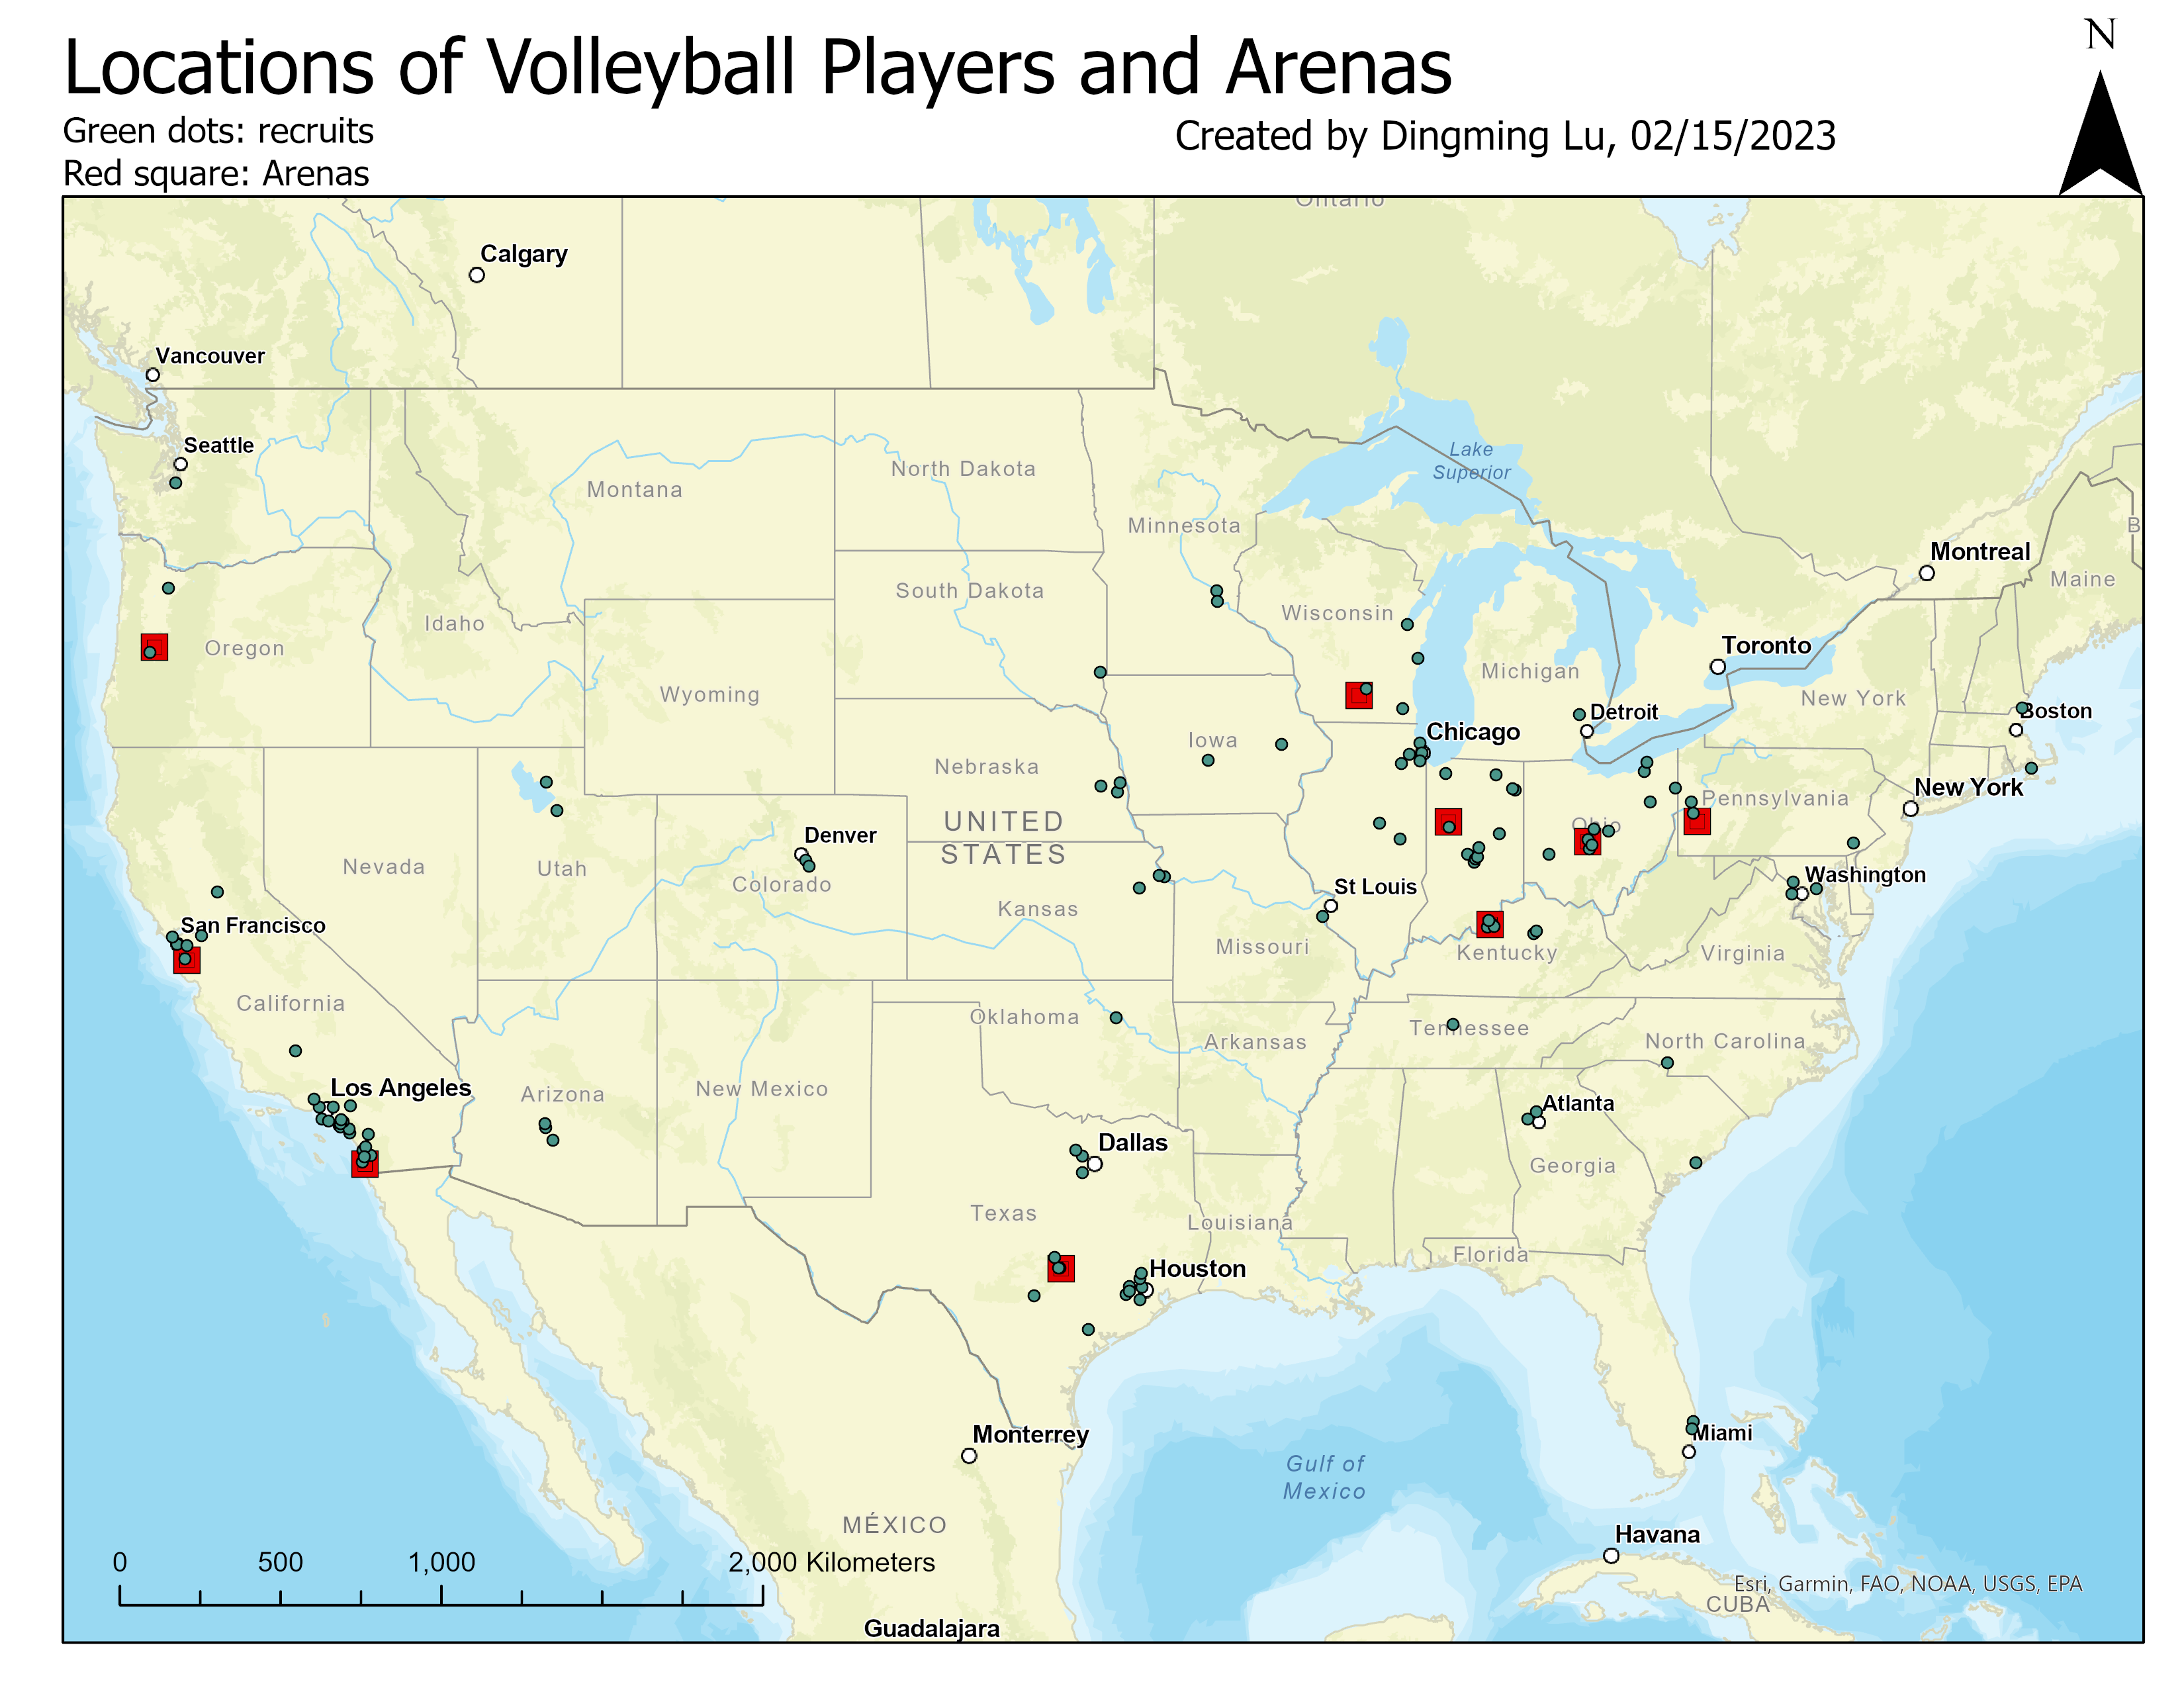
Figure 1: Input data onto the base map. Mainly three groups are scattering across the US, near OH-IN-IL, Texas, and CA. Most players in CA are in San Francisco and Los Angeles. In Texas, most players are in Houston. Players near OH-IN-IL are nearly evenly distributed.

III.  Adding Buffer and Buffer Rings to the Map

Buffer highlights the area around points of interest within a given radius. 
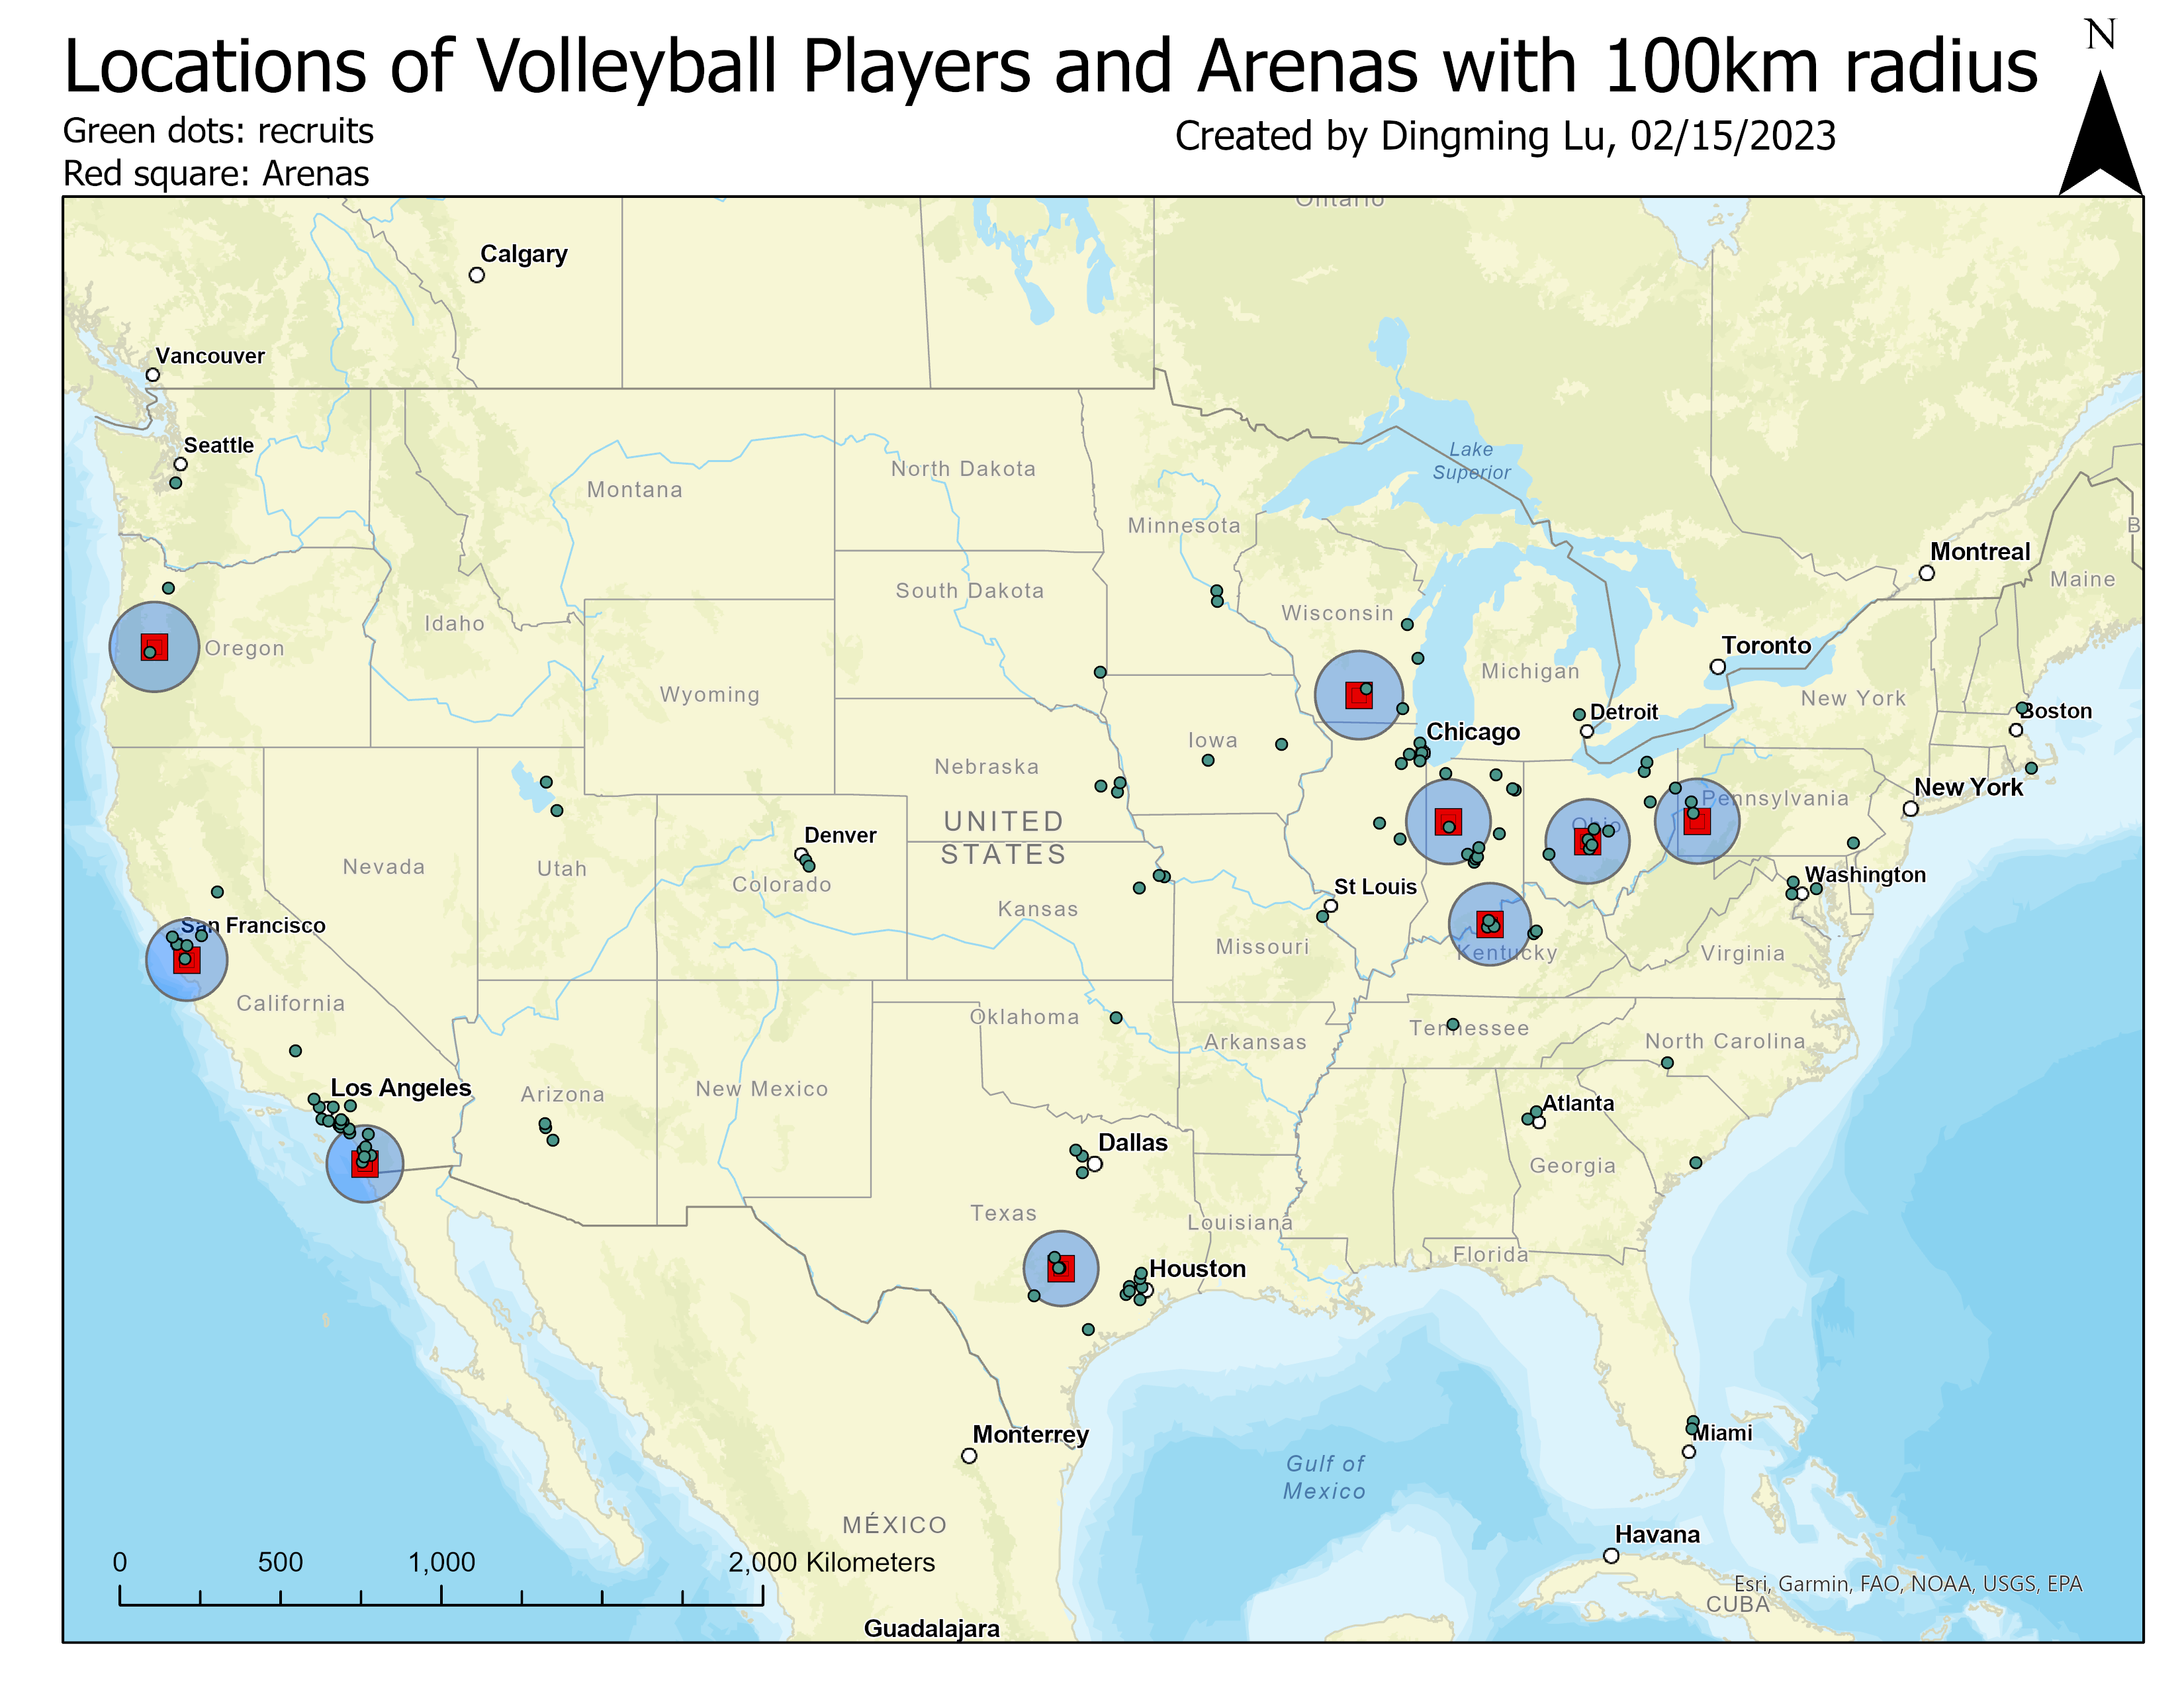
Figure 2: 100km buffer at each arenas. The arena in San Diego has 7 recruits within its 100km. Arenas at Eugene and Madison have the fewest.

Purdue will be the team of interest in the rest of the lab. 
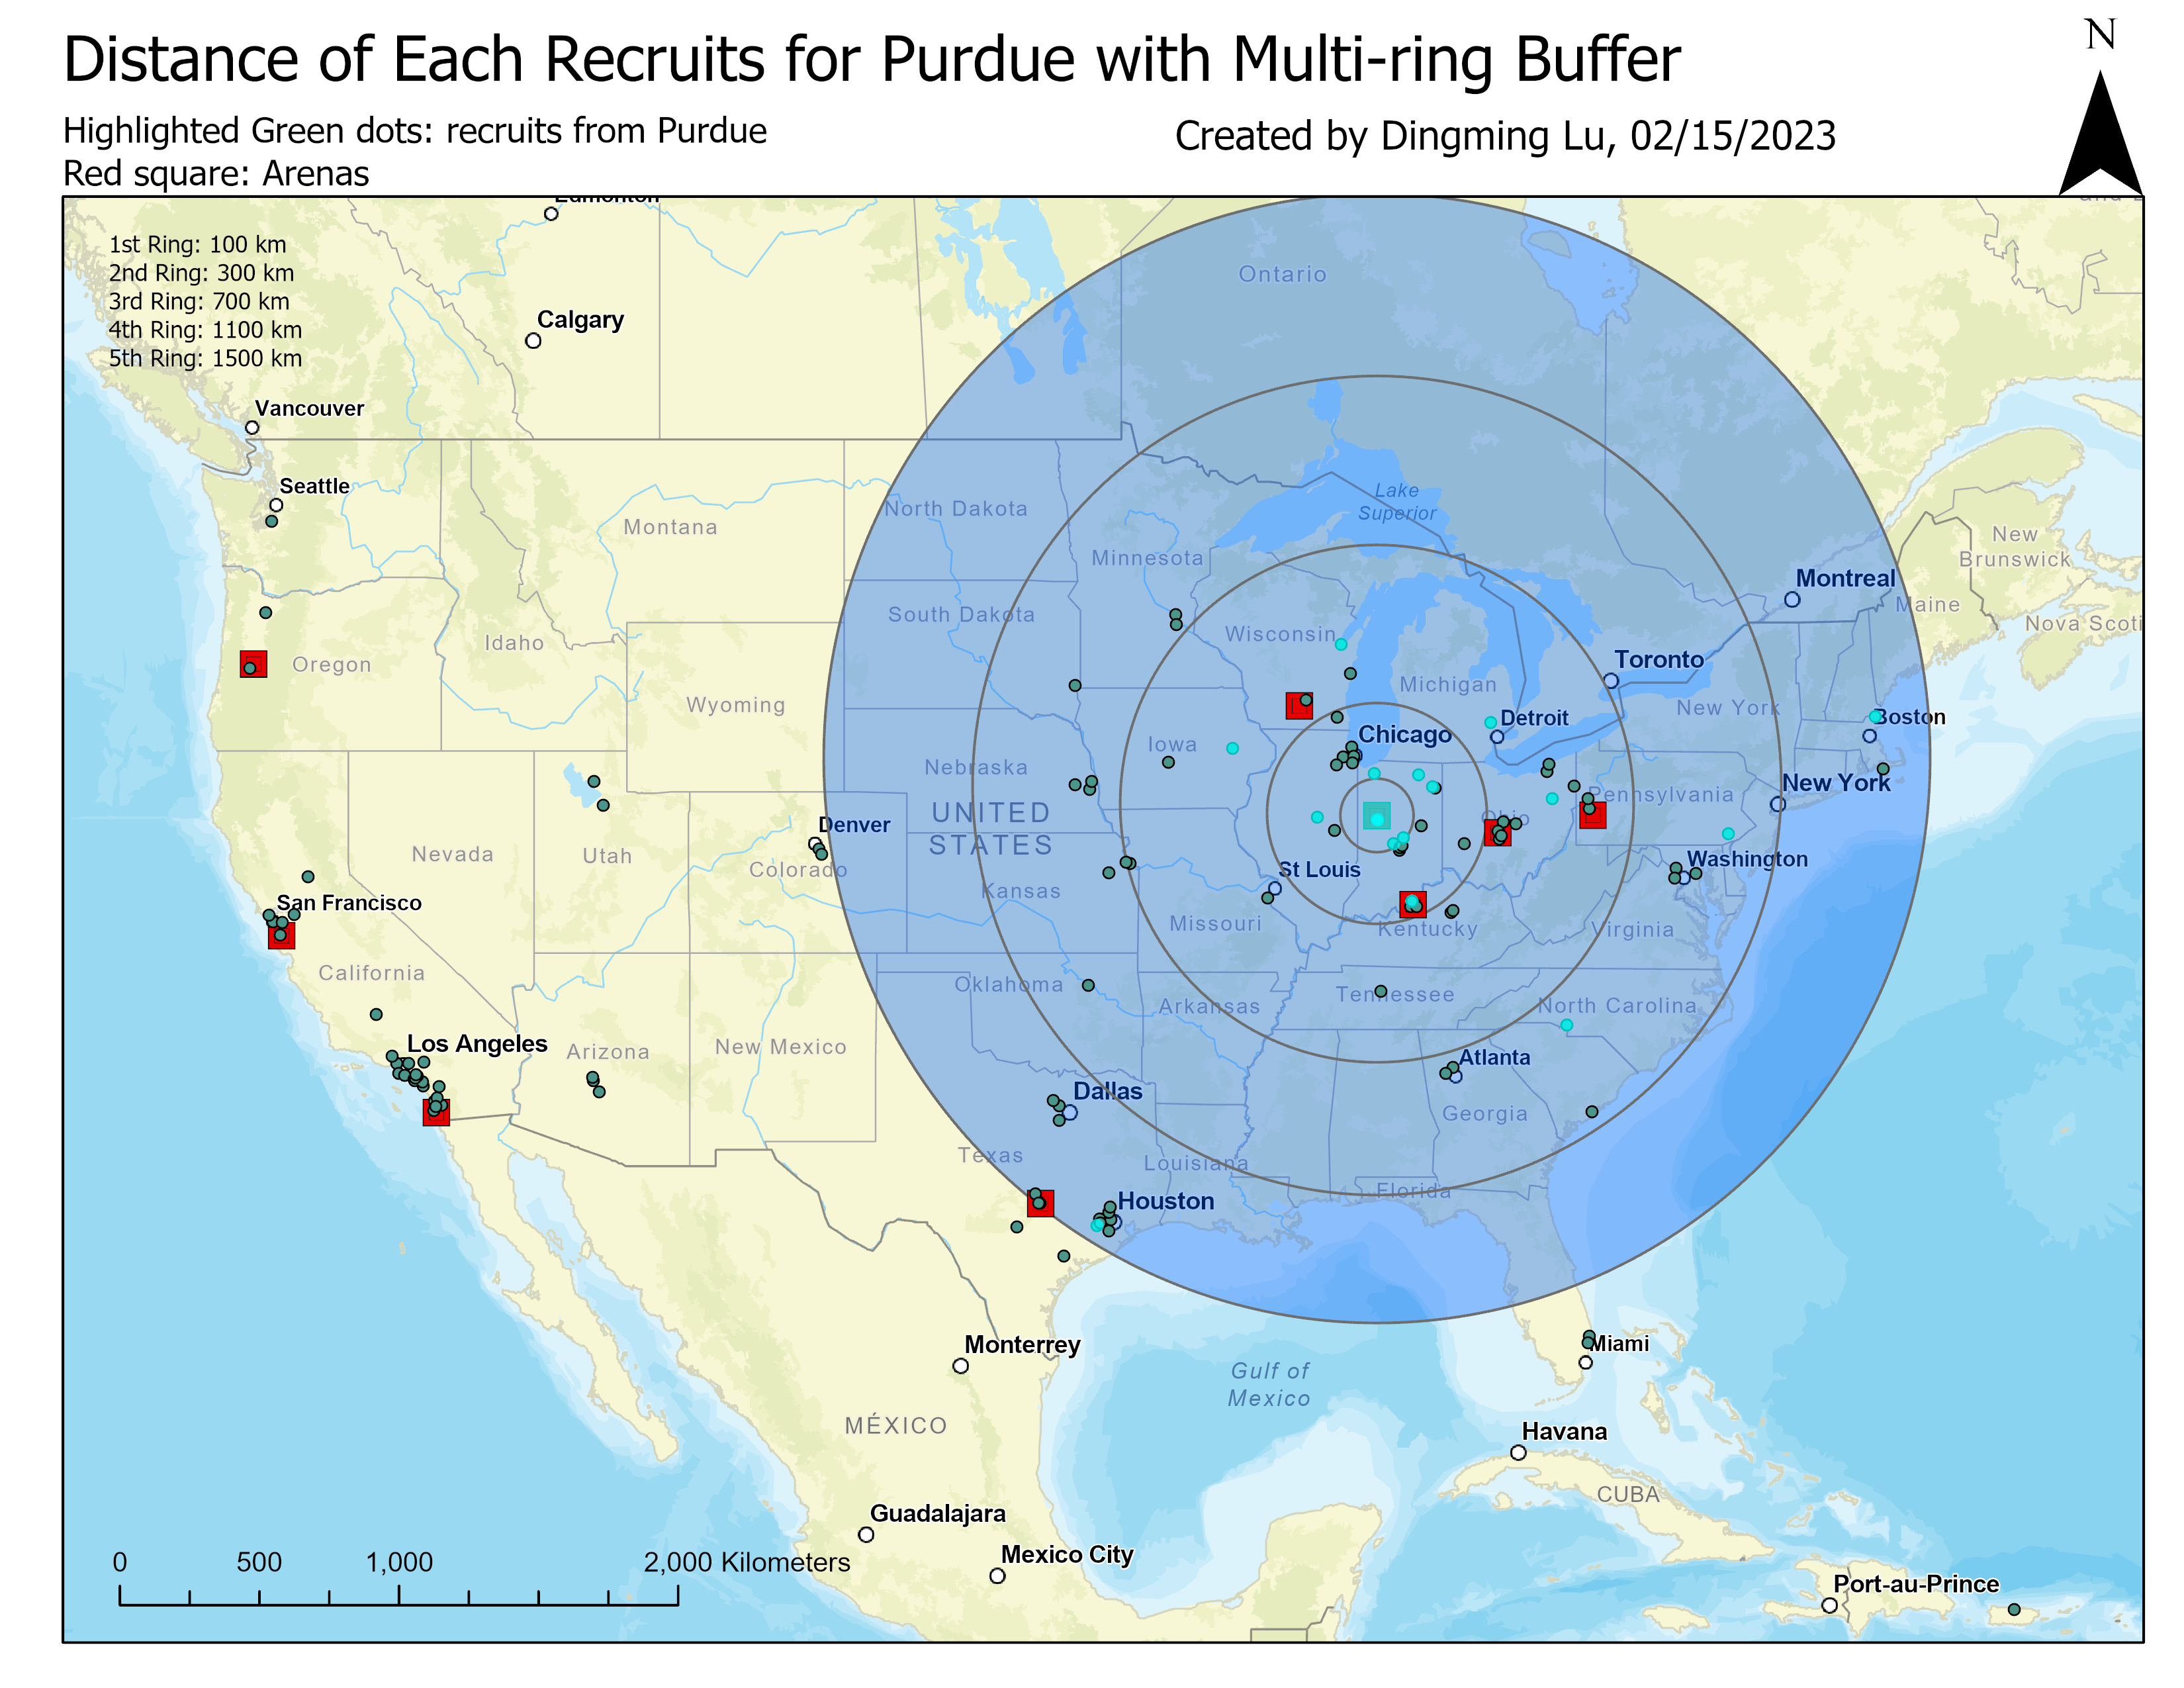
Figure 3: Buffer rings around the Purdue Arena. Most of the players came within 700 km radius from Purdue. Only two players came from the outer most ring (1100 km to 1500 km)

 IV. Origin-Destination Links

Origin-Destination links helps us to visualize where they were from for a particular group (recruits for Purdue in this case)
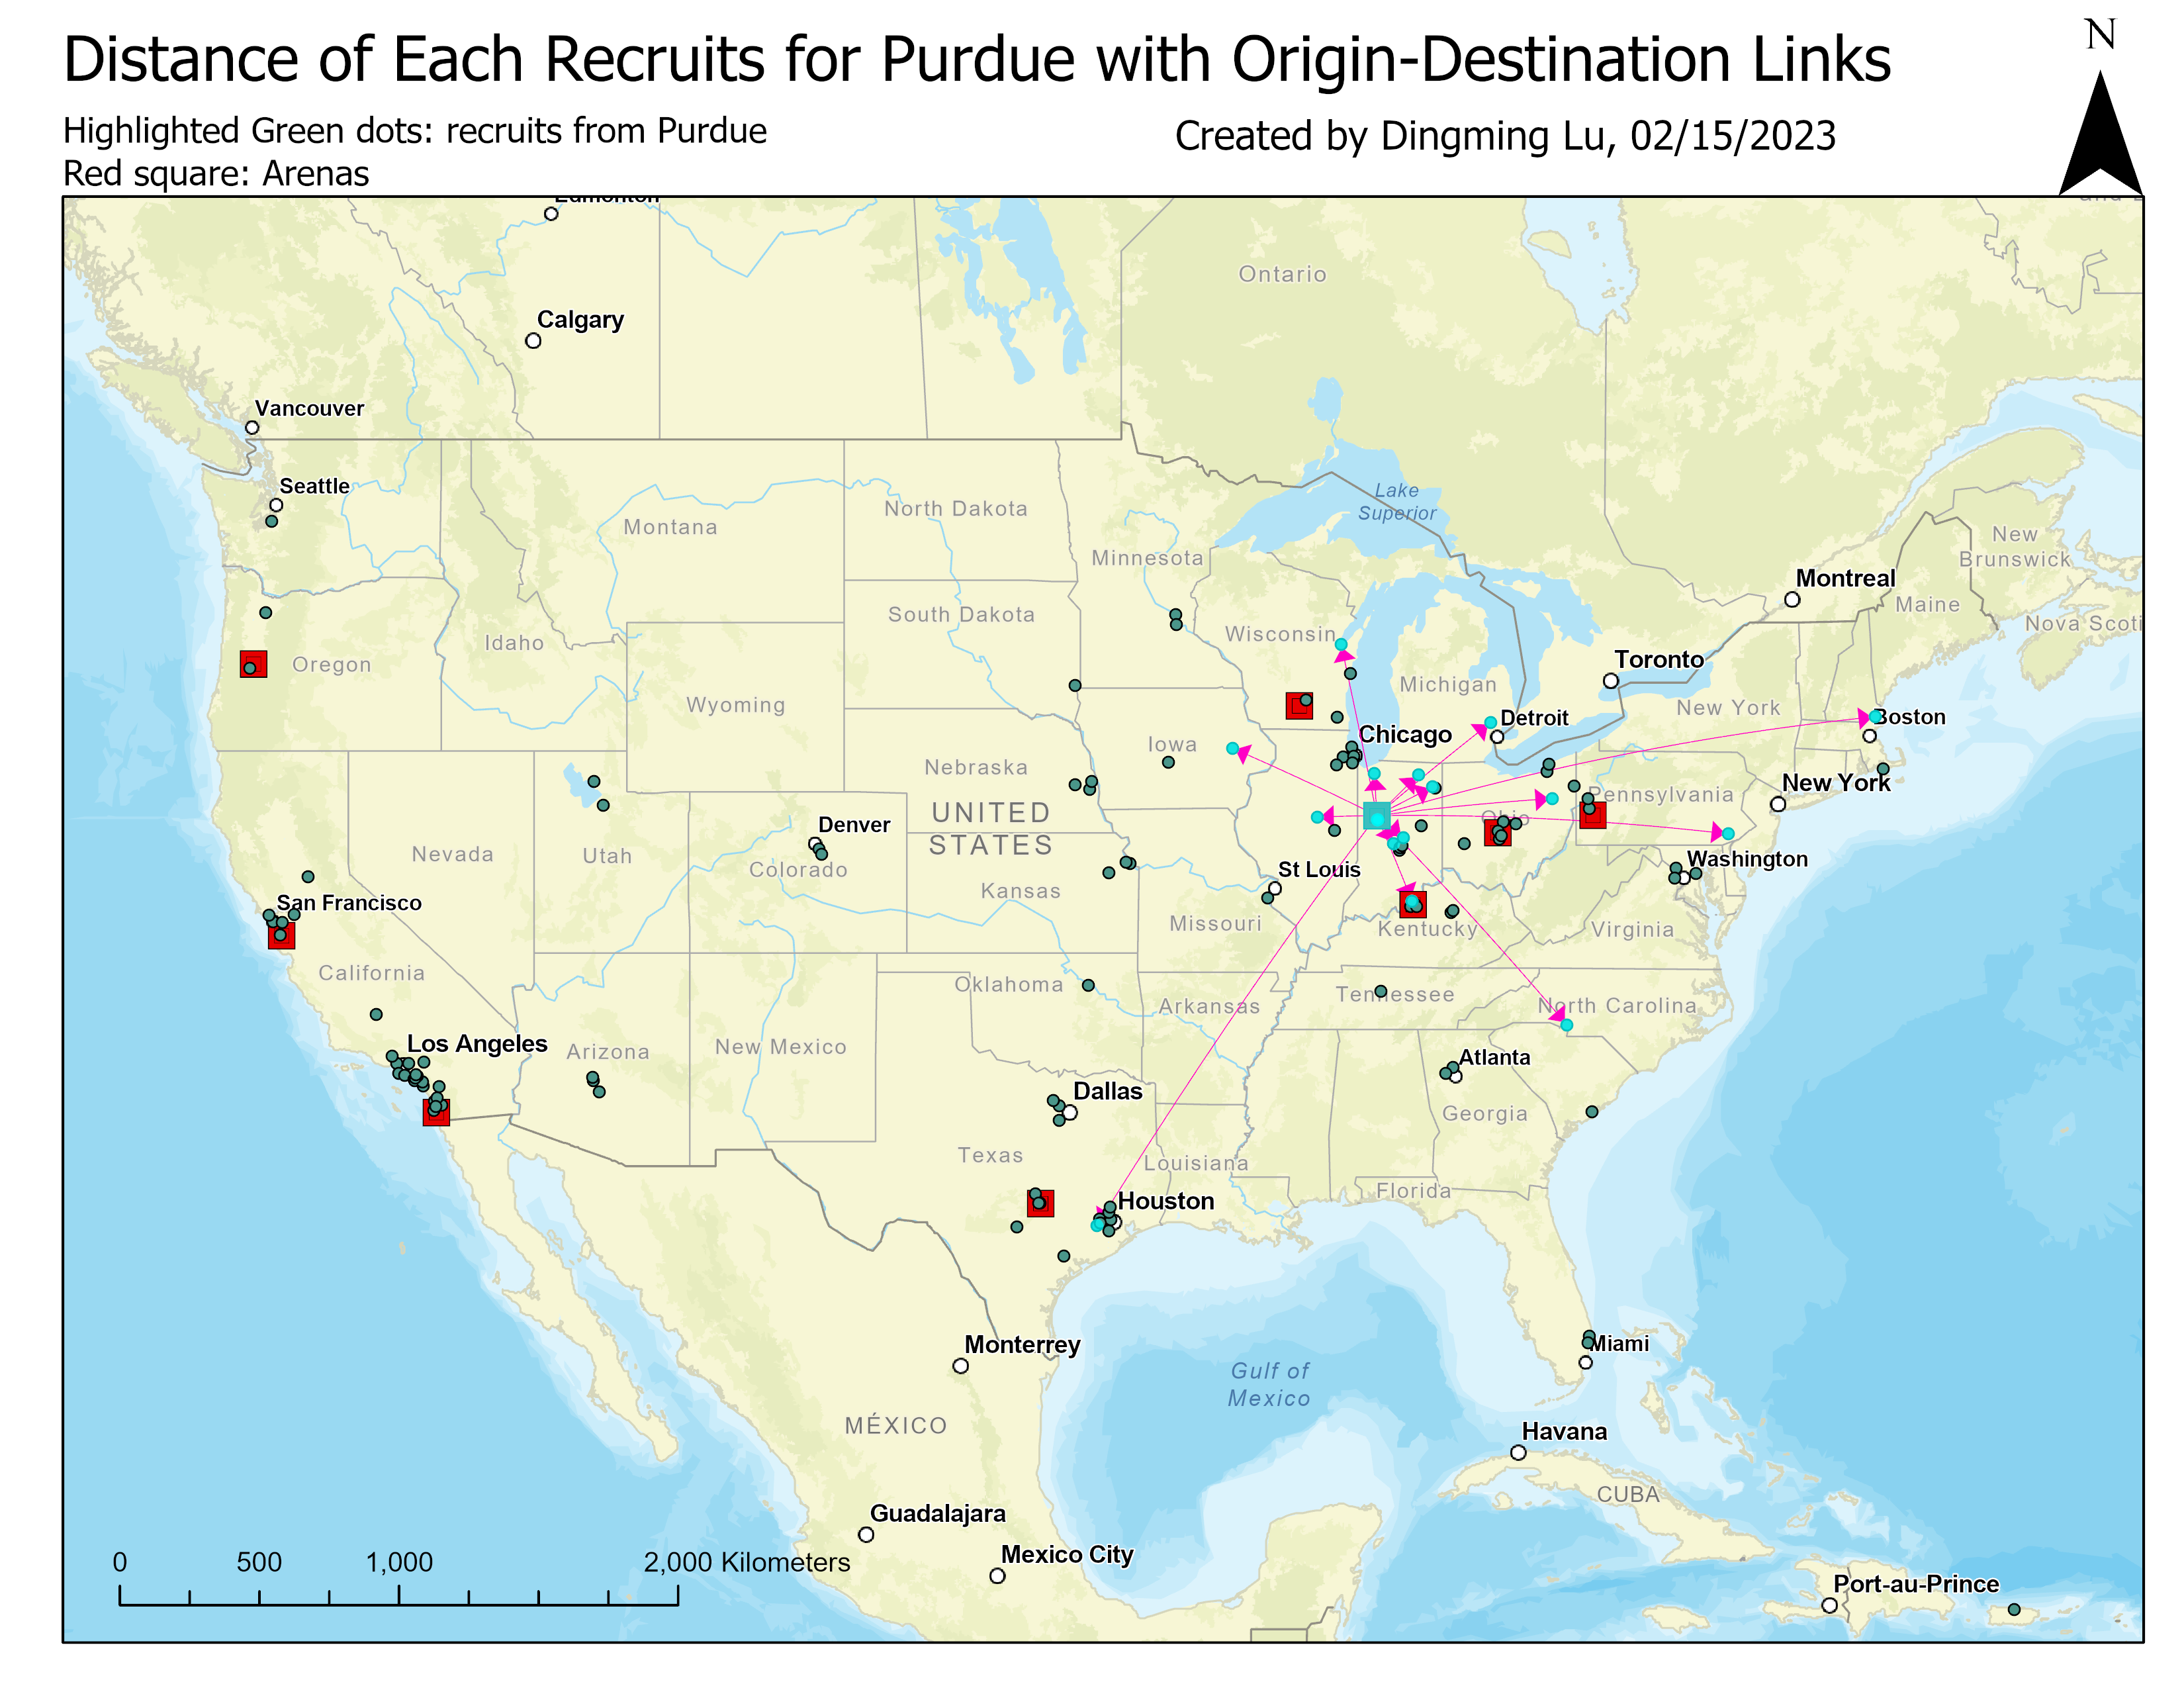
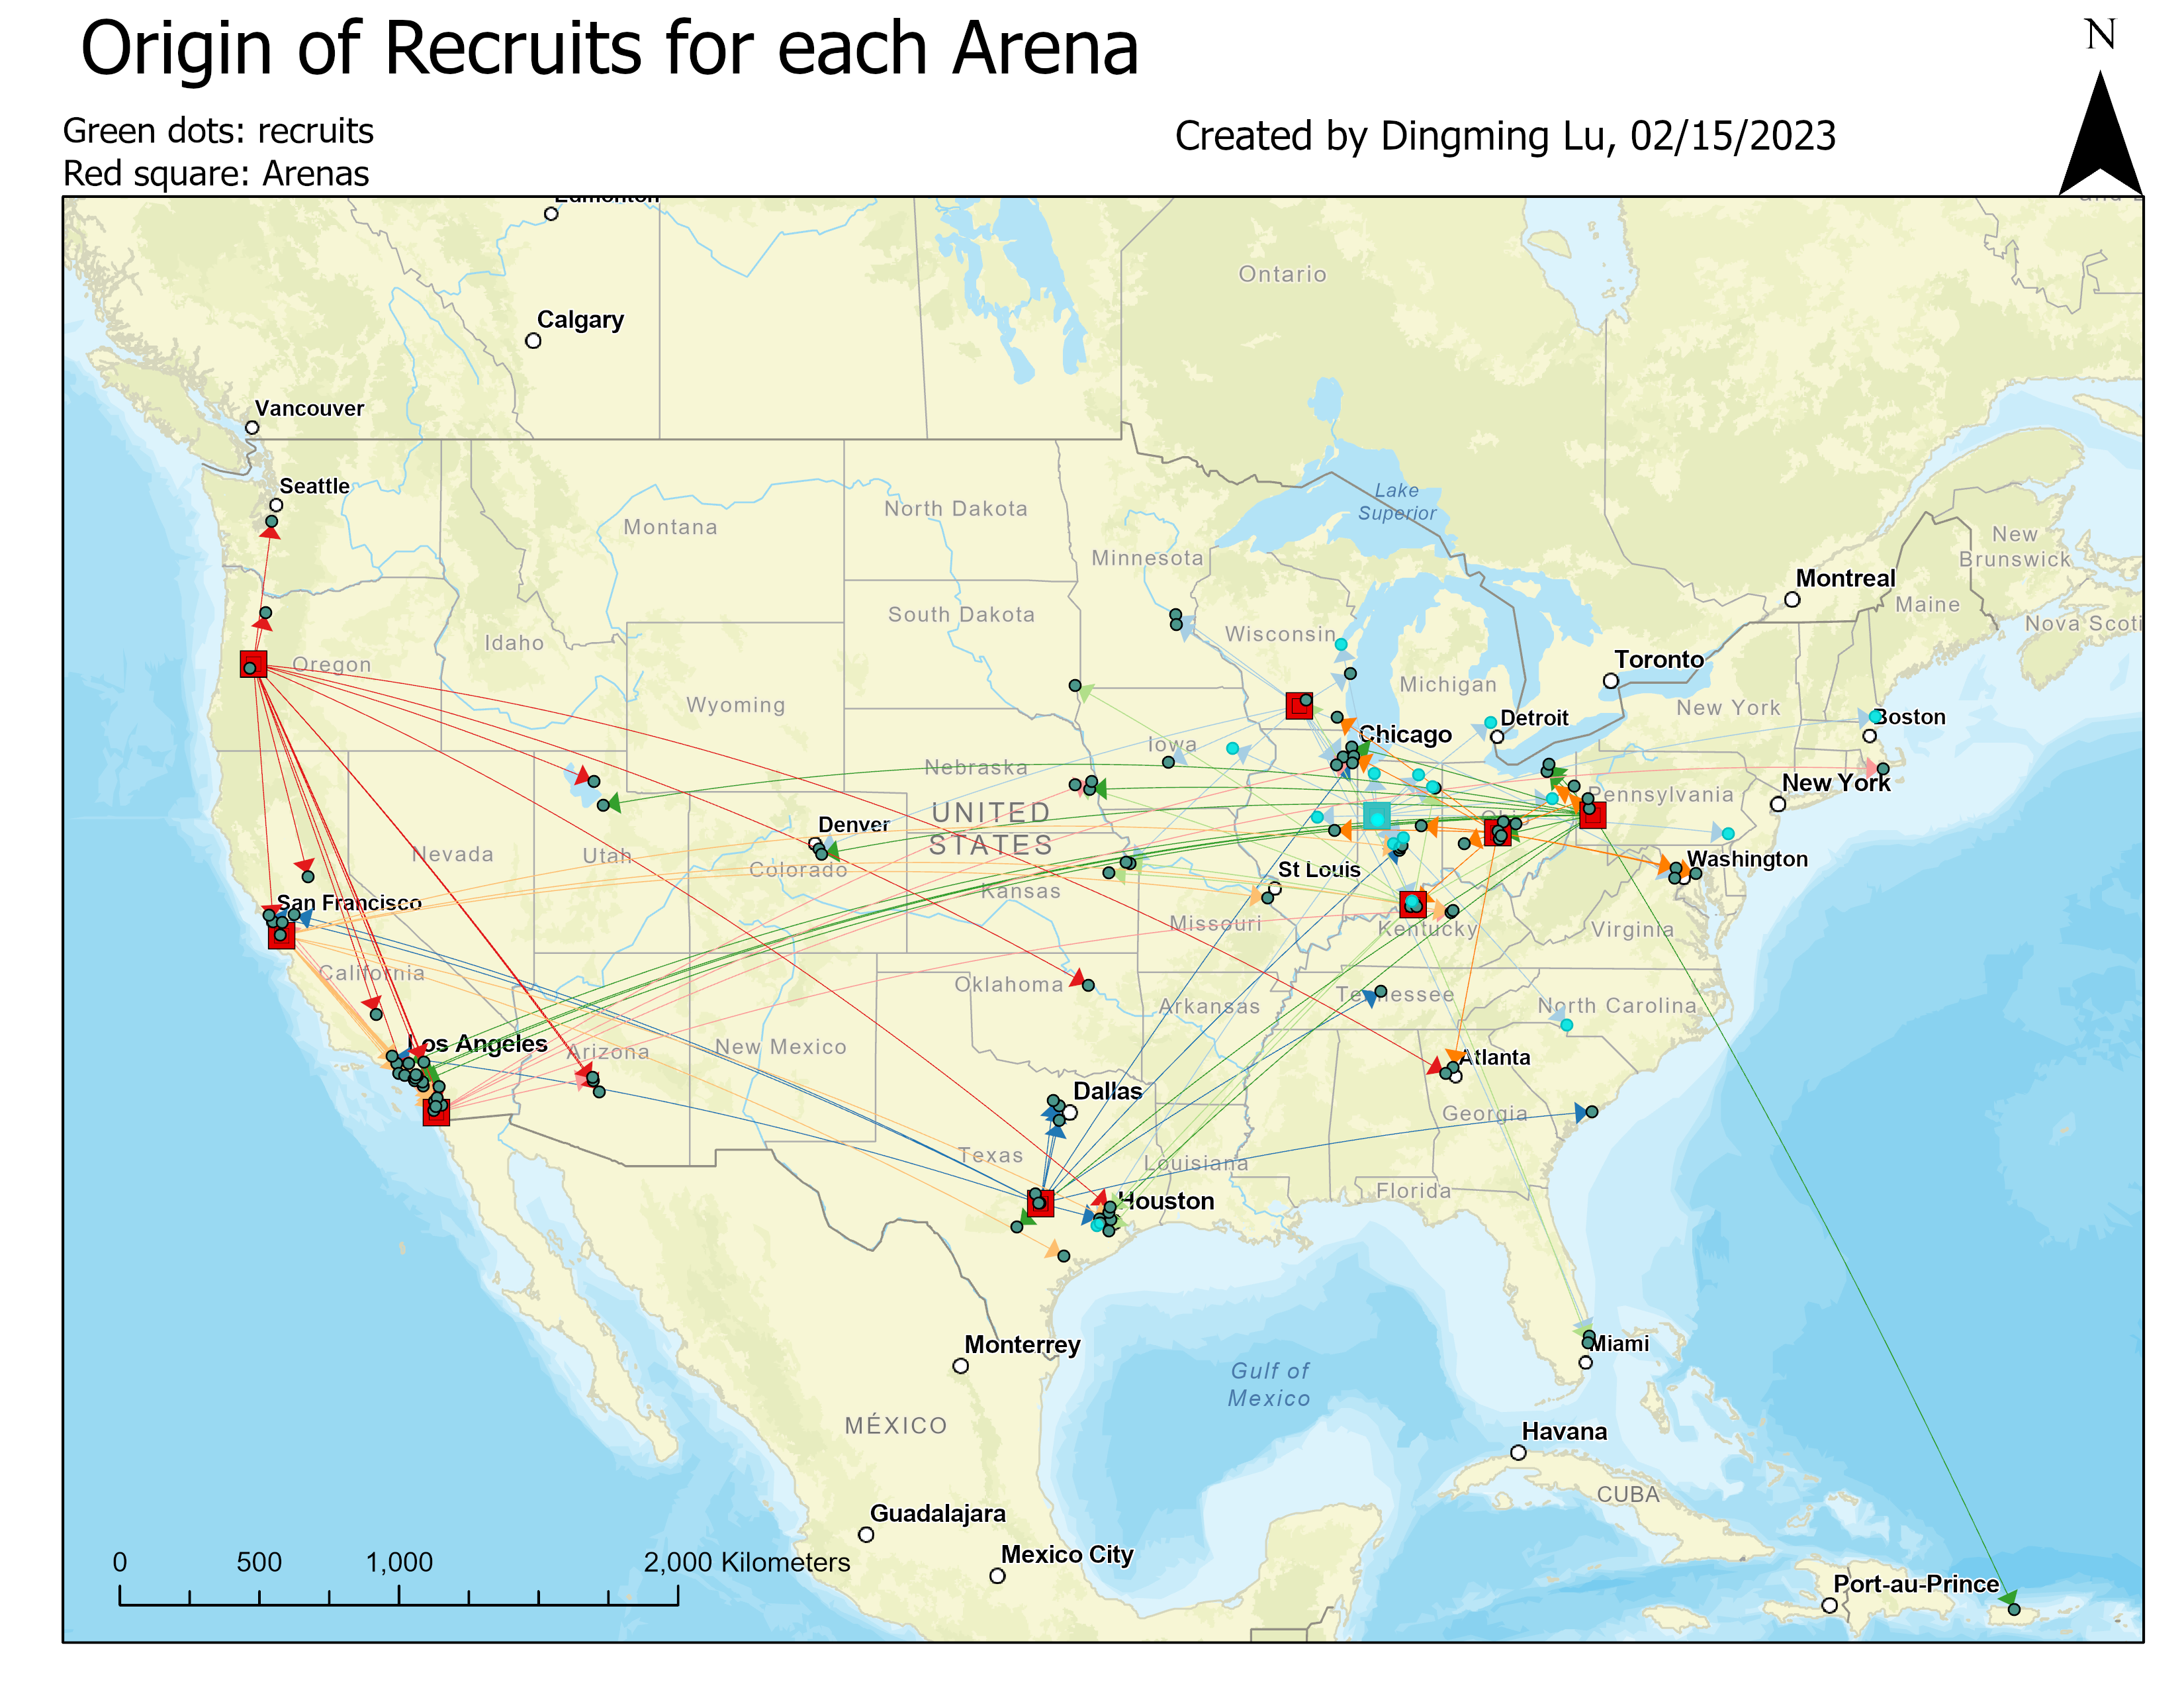
Figure 4: Origin-Destination Map. Many of them came from the Indiana state. Most of them are relatively close compared to the players from Houston and east coast.
Figure 5: Origin-Destination Map. Most of the links are very far away. The smallest mean distance is 317km from Ohio State, and the largest mean distance is 1987 km from University of Pittsburgh. Most of the universities have recruits who came from the same state. For many universities, recruits are from CA, Texas, and OH-IN-IL area.

 V. Near Table

A table that shows the distribution of data. 
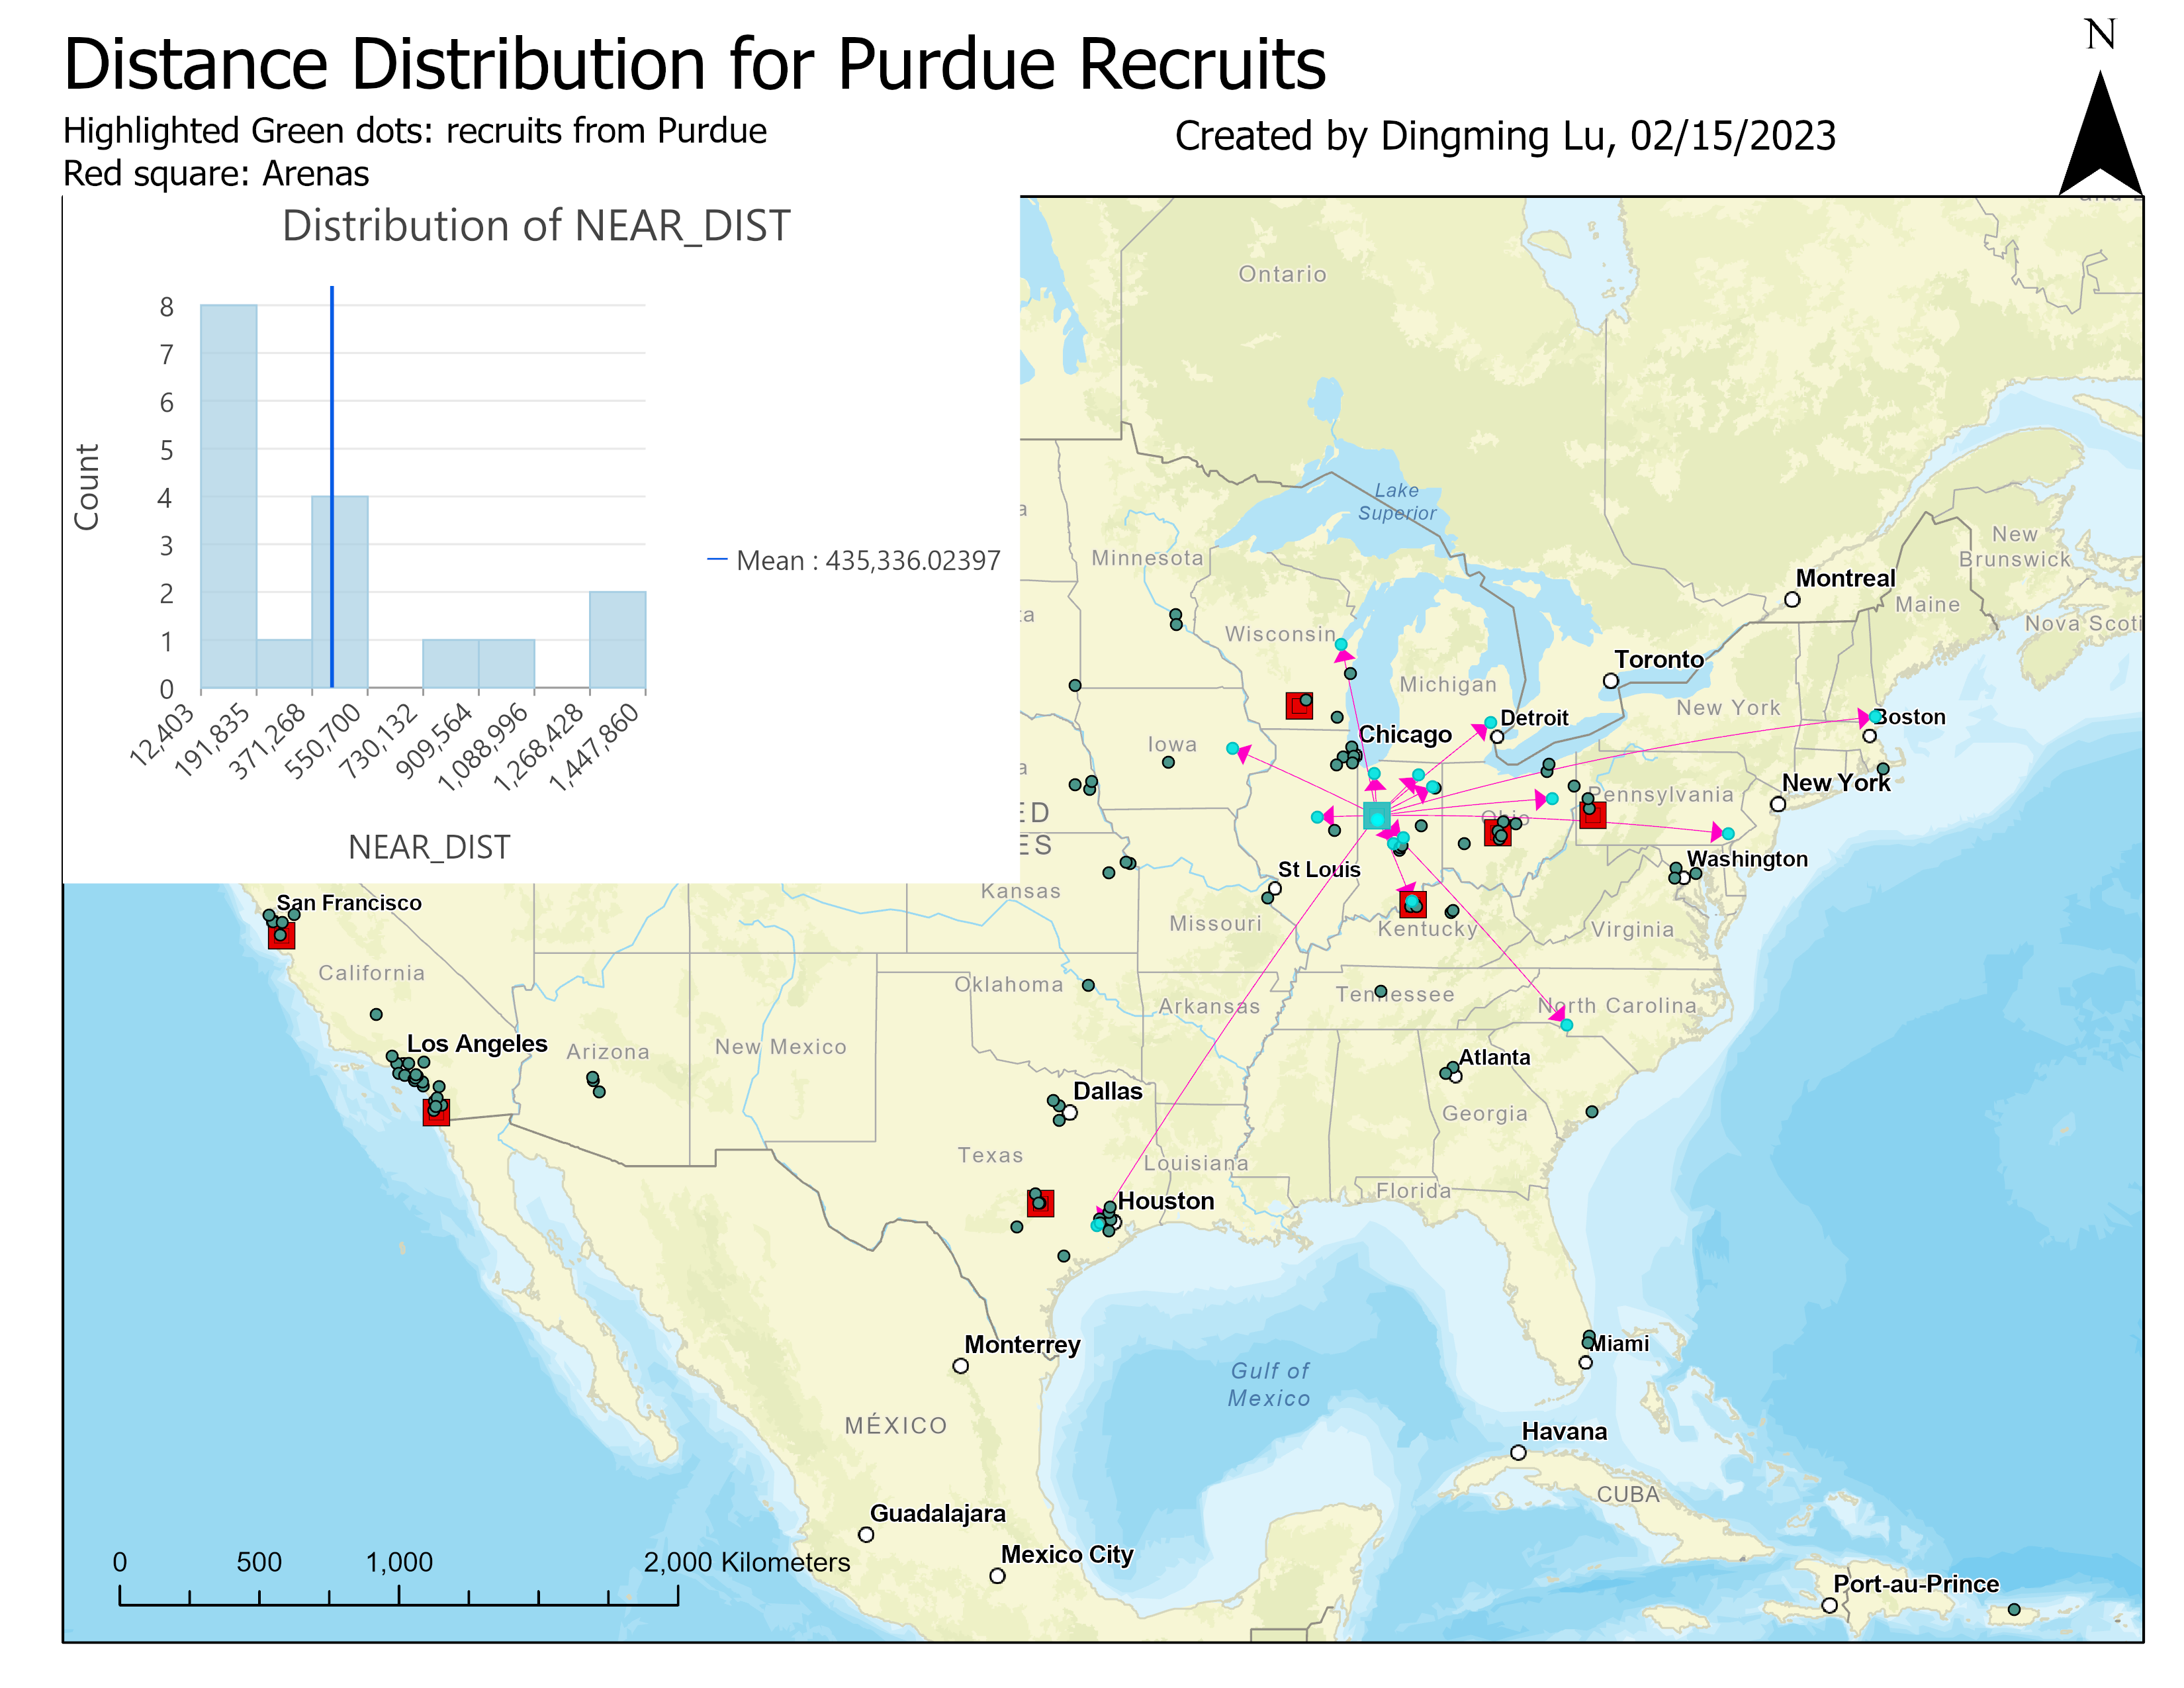
Figure 6: Distribution regarding distance for Purdue recruits

VI. Combined

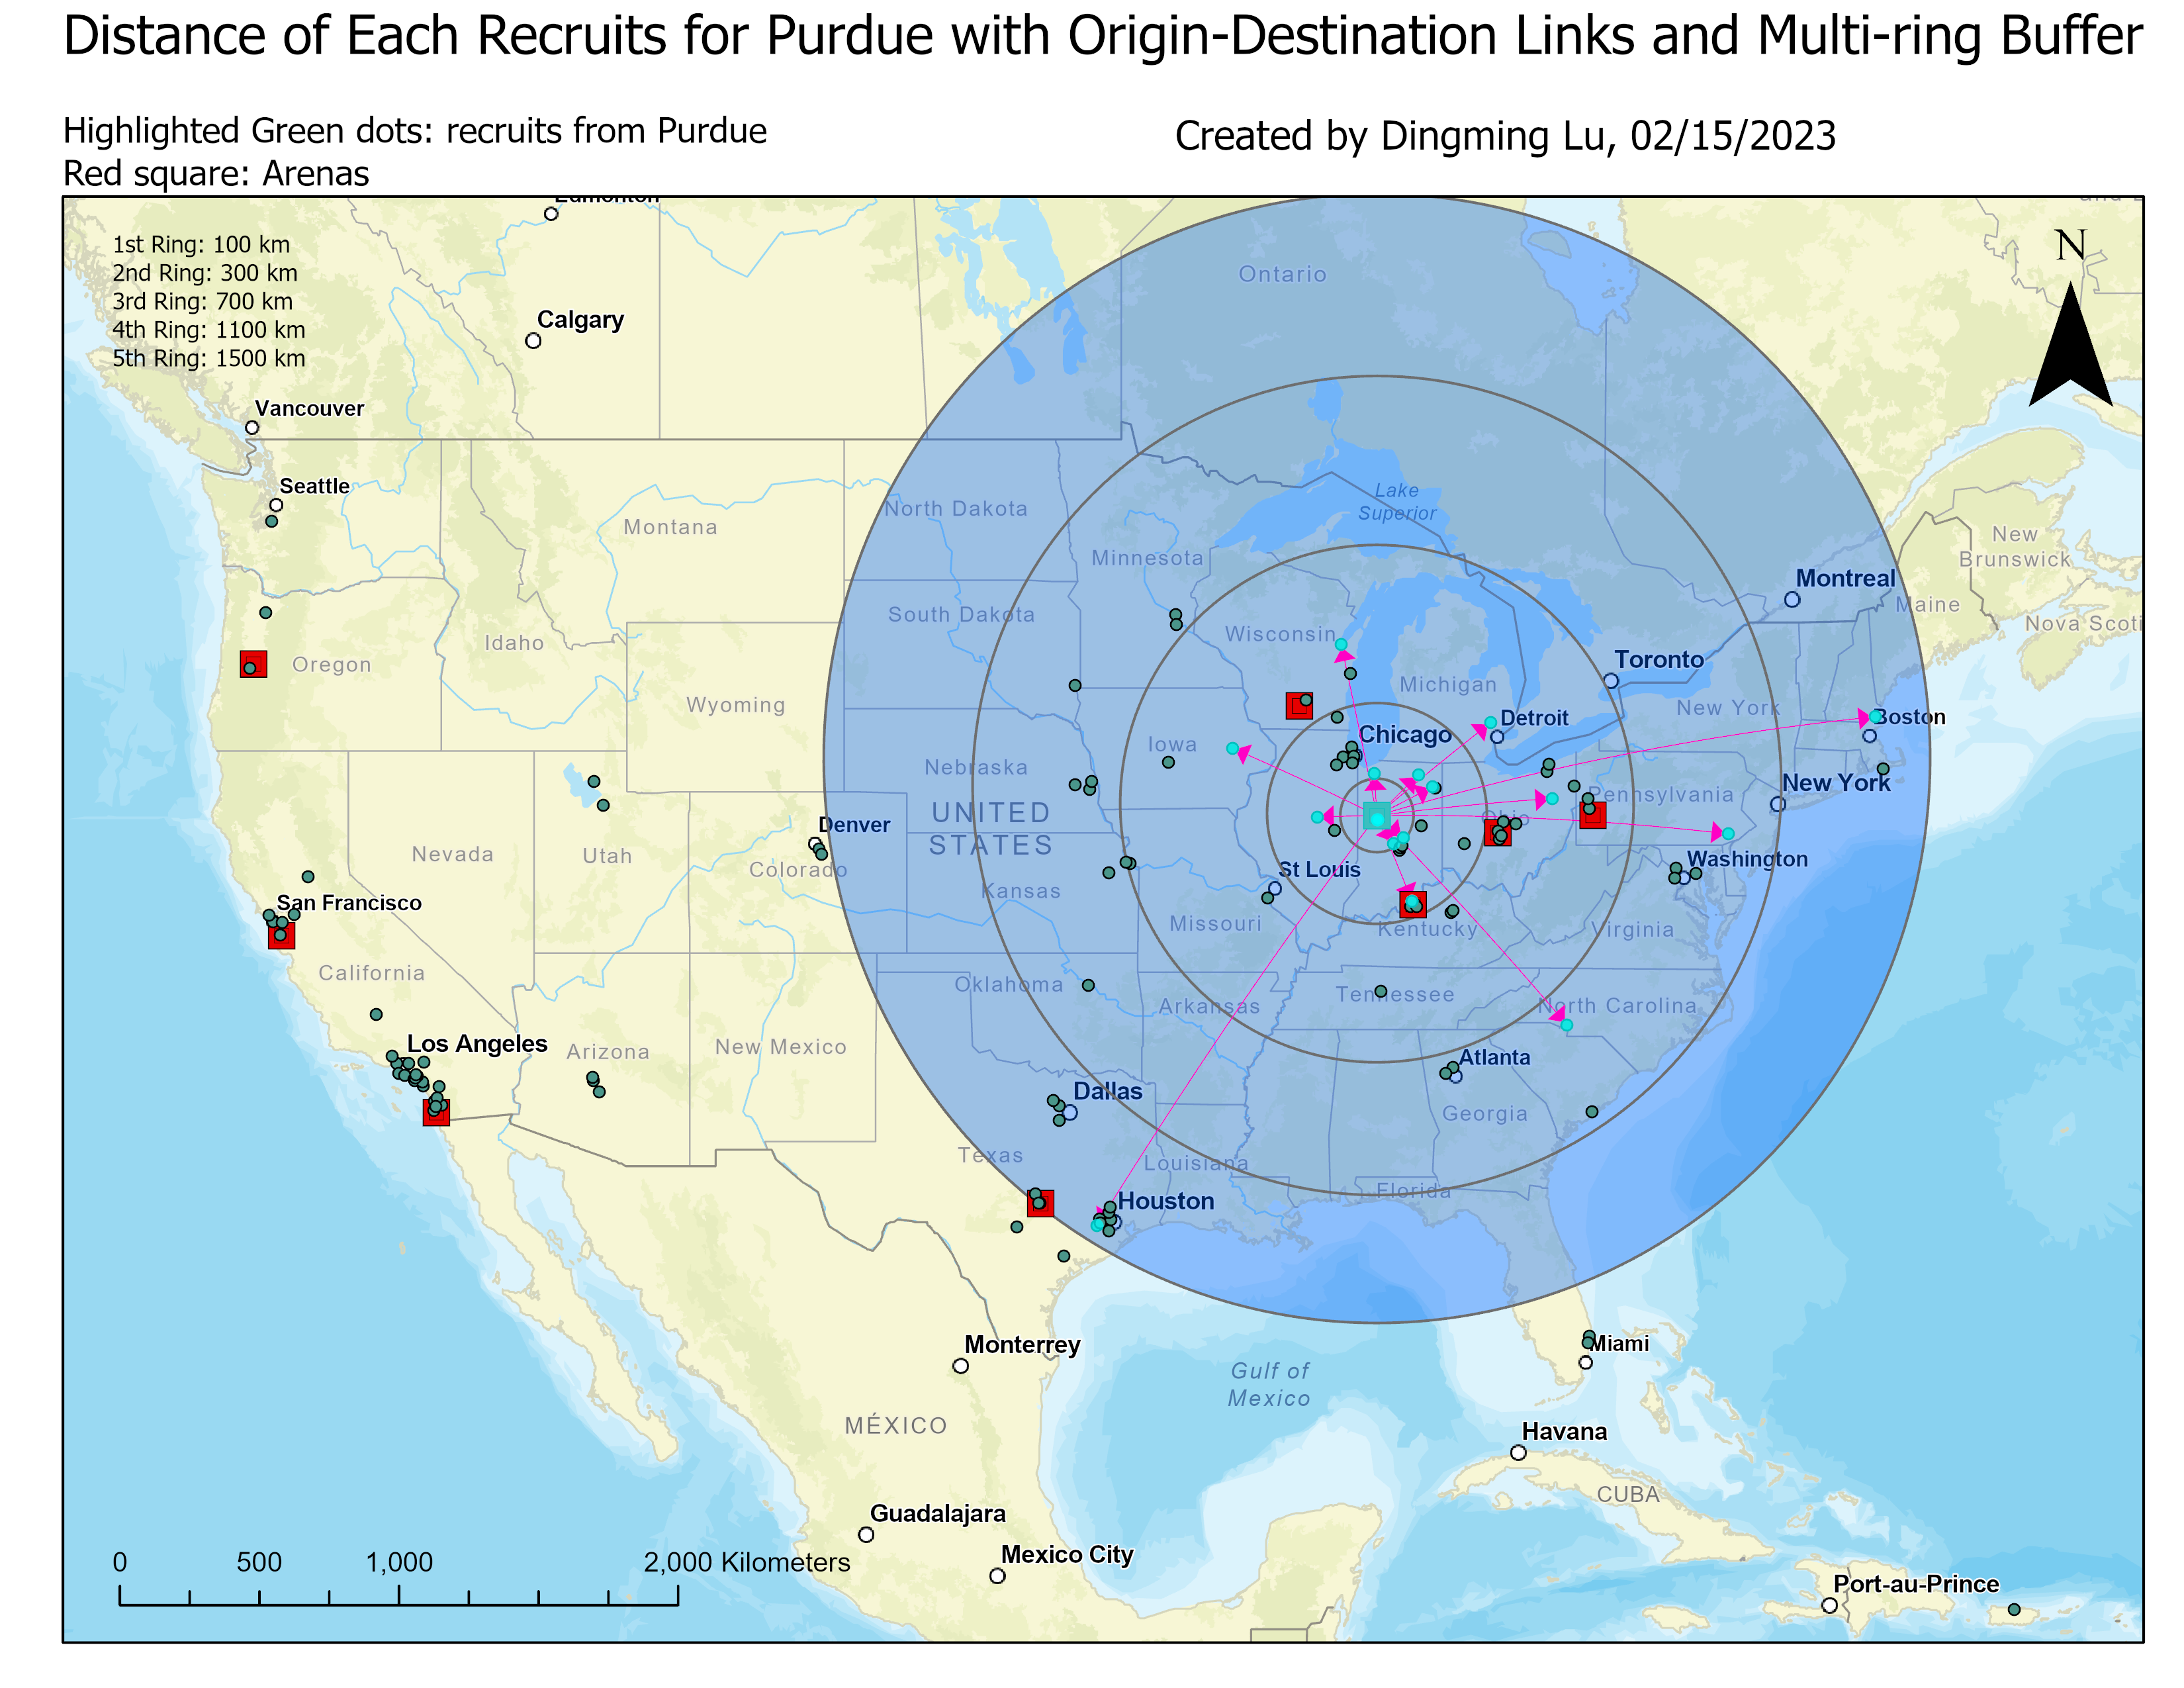
Figure 7: The origin-destination links show thw recruiting patterns the best because it can highlight the branches of each origin, and each destination is outstanding and easy to see. Combine the origin-destination links with the multi-ring buffer, we can see how far each recruit came from.

Leave a Reply

Your email address will not be published. Required fields are marked *