I. Intro
Date: 10/24/2022
In ArcGIS Pro, we can put our mapping image into it, set each band to a color, see the color difference, and look for what we want.
II. Pre-Burn and Post-Burn
1. DoakBurn ArcPro Project was opened.
2. “Doakspostburn_band6_mosaic_lwir” was added to the map
3. “Doaksburn_thermalprocess_mosaic_lwir” was added to the map
4. “Doakspreburn_1to5” was added to the map.
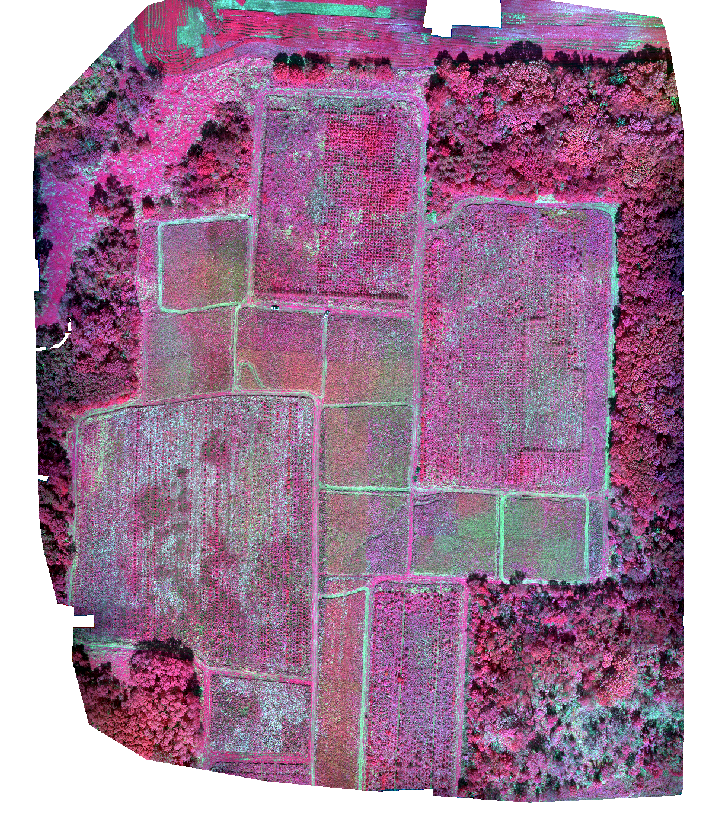
5. Go to symbology, Band 5: Red; Band3: Green; Band 2: Blue.
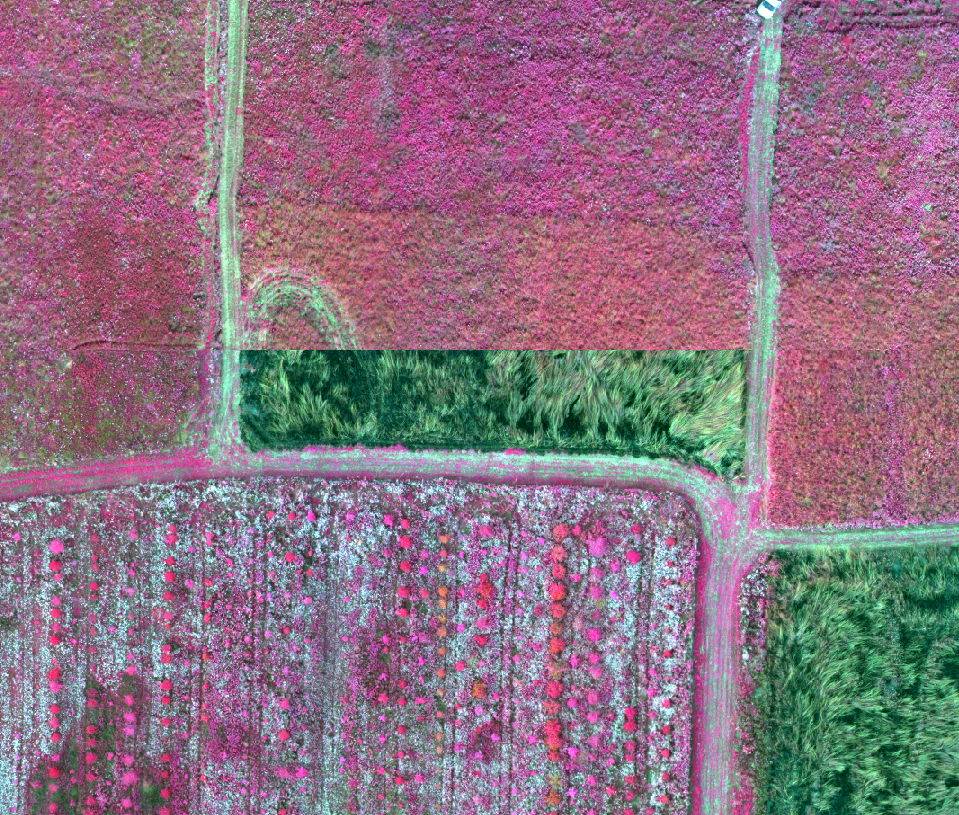
6. Now the plants are standing out. The tall grass in the field is pink, and the tree leaves are deeper red.

7. “Doakspostburn_1to5” was added to the map. Some areas appeared dark brown, and we applied the same settings.
8. Use the swipe tool to see the difference of the two layers.

III. Normalized Difference Vegetation Index (NDVI)
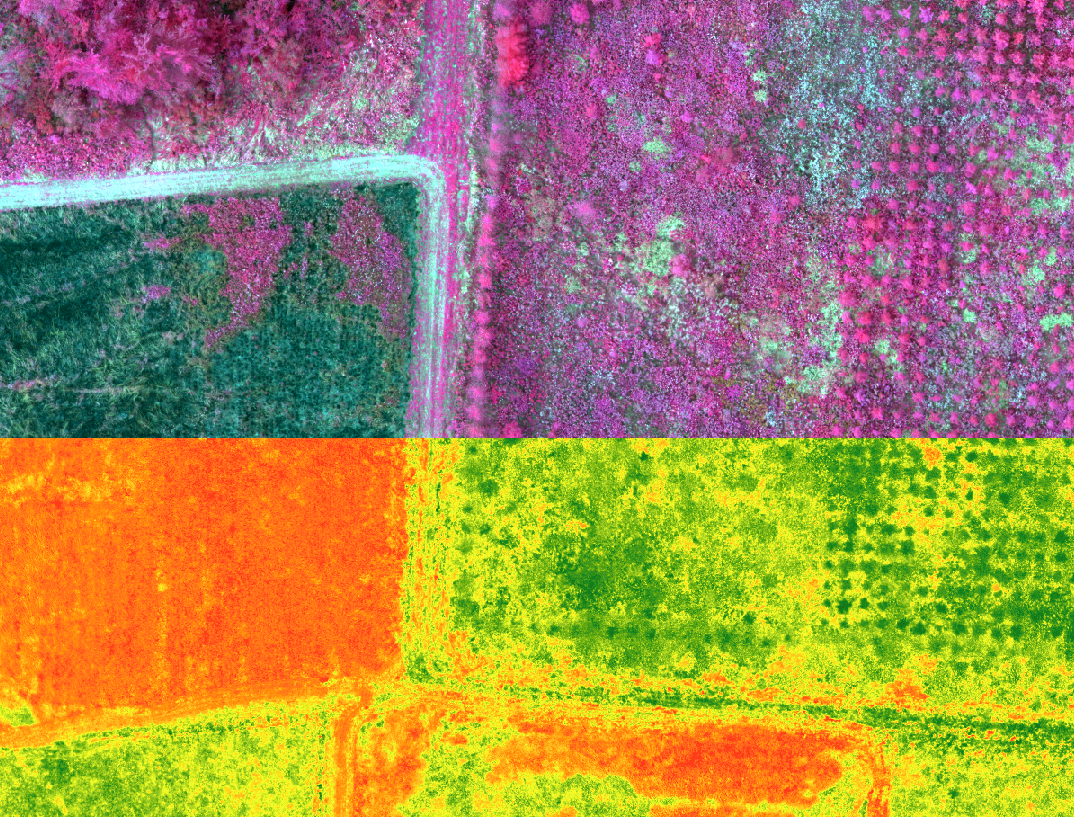
1. “Doakspostburn_NDVI” is added to the map.
2. The burned field is red, the short plants in the field are yellow, and the tree leaves are green.
3. This NDVI was compared with the post-burn map using the swipe feature.

IV. Band Combination
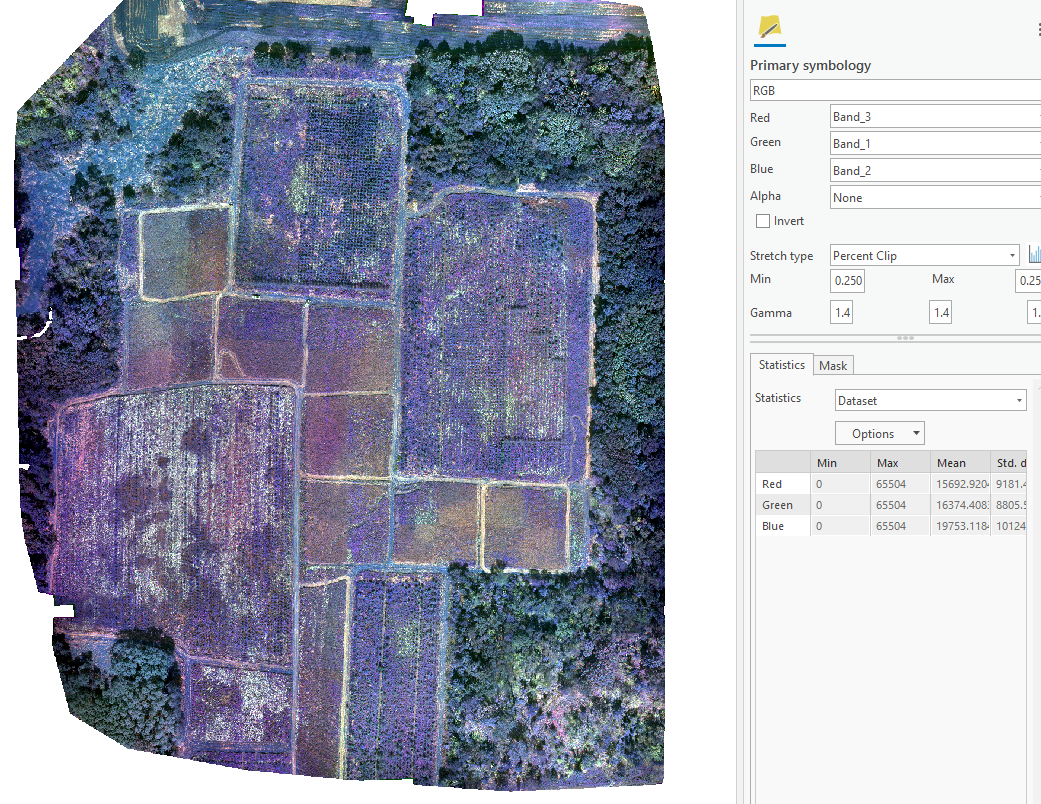
1. Band 1: Green; Band 2: Blue; Band 3: Red.
2. Now it shows the difference between the dirt roads. Some part of the dirt road appears light yellow, but some part shows blue.
