I. Intro
Date: 09/26/2022
We used Pix4D Mapping to create a large picture of the whole area.
II. Preparation
1. Copy the images into a folder: lu807_091922_PEA_plot5 → 1_Collection → images
2. Open Pix4D Mapping → create a new project → name it lu807_091922_PEA_plot5_noGCP_122meters
3. Browse the folder → lu807_091922_PEA_plot5 → 2_Processing
4. Next
5. Import the images → Selected Camera Model → Edit → Camera Model Parameters → Shutter Model → Linear Rolling Shutter → OK
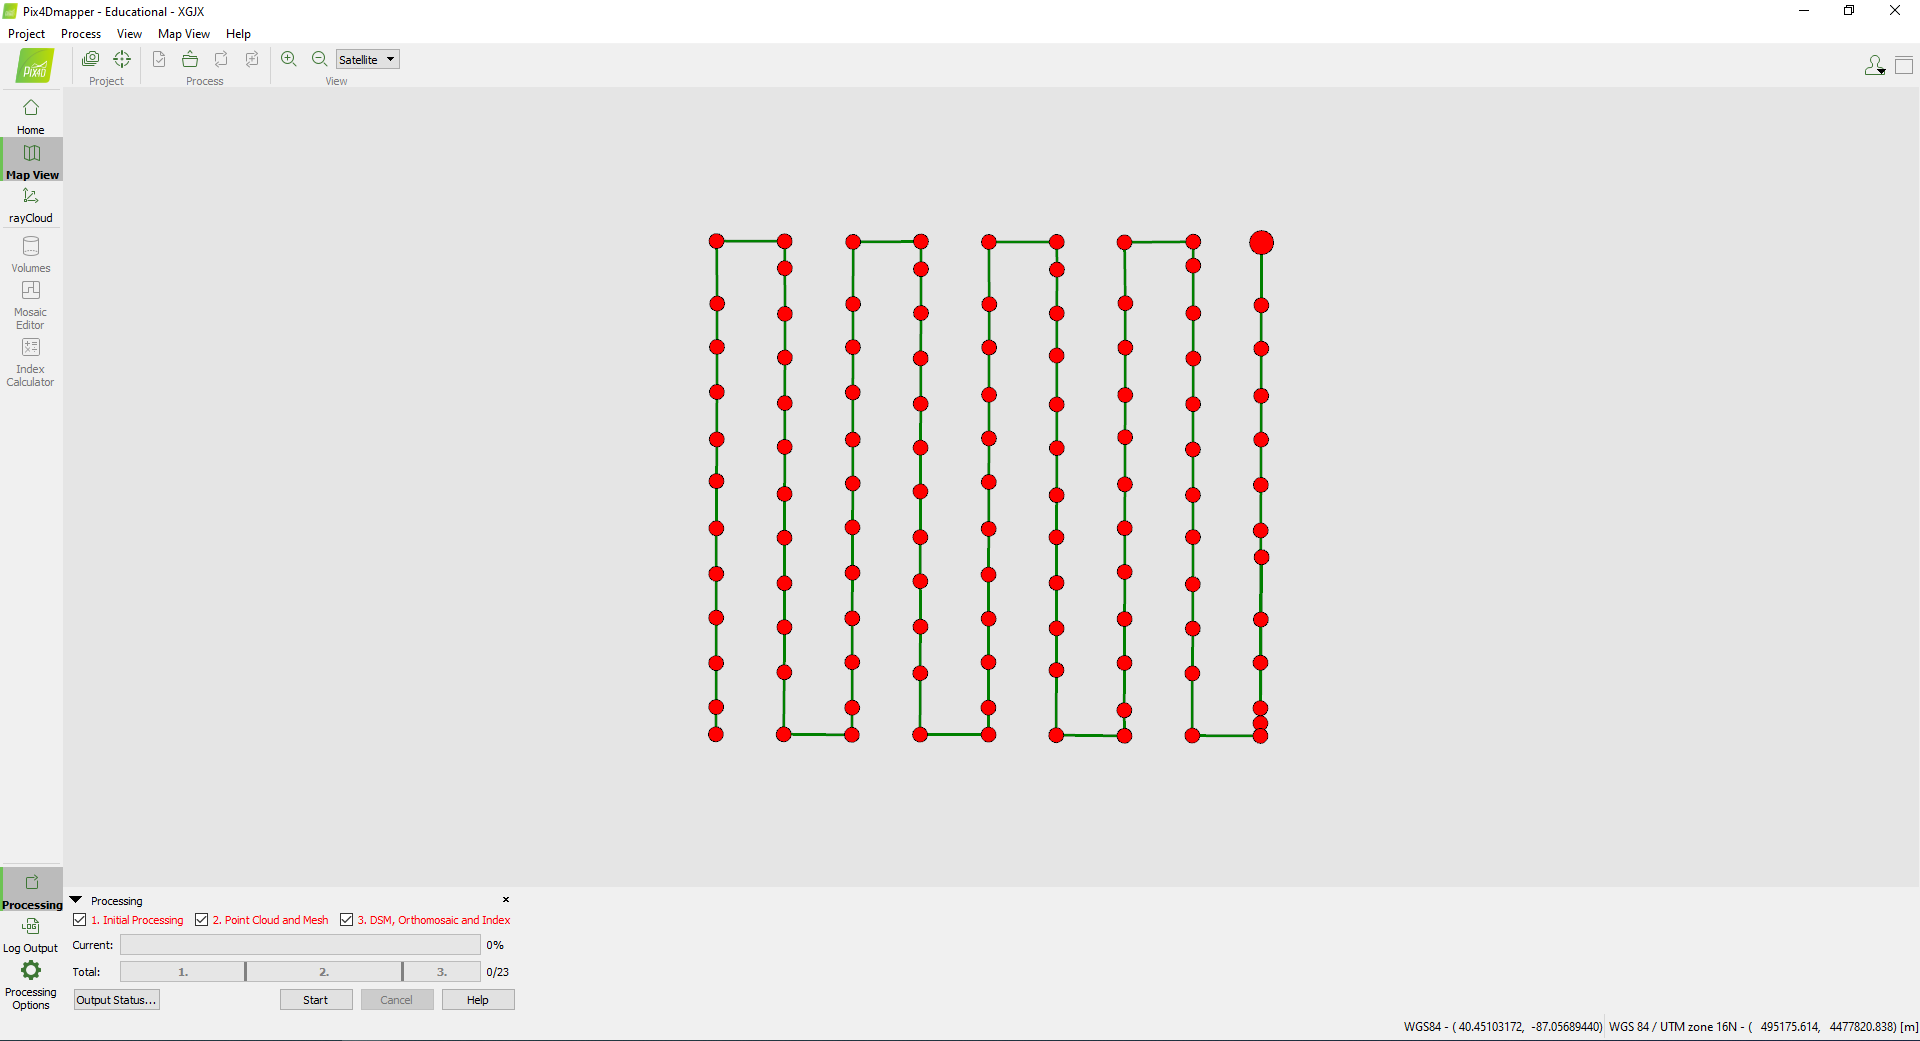
5. Check if the images are geotagged.
6. Next >
7. Output/GCP Coordinate System → Known Coordinate System [m] → From EPSG → 6345 → NAD83(2011) / UTM zone 16N (Projected, Meters)
8. Next >
9. Standard → 3D Maps → Finish
III. Initial Processing
1. Processing Options → 3. DSM, Orthomosaic and Index → Raster DSM → Method → Triangulation
2. OK
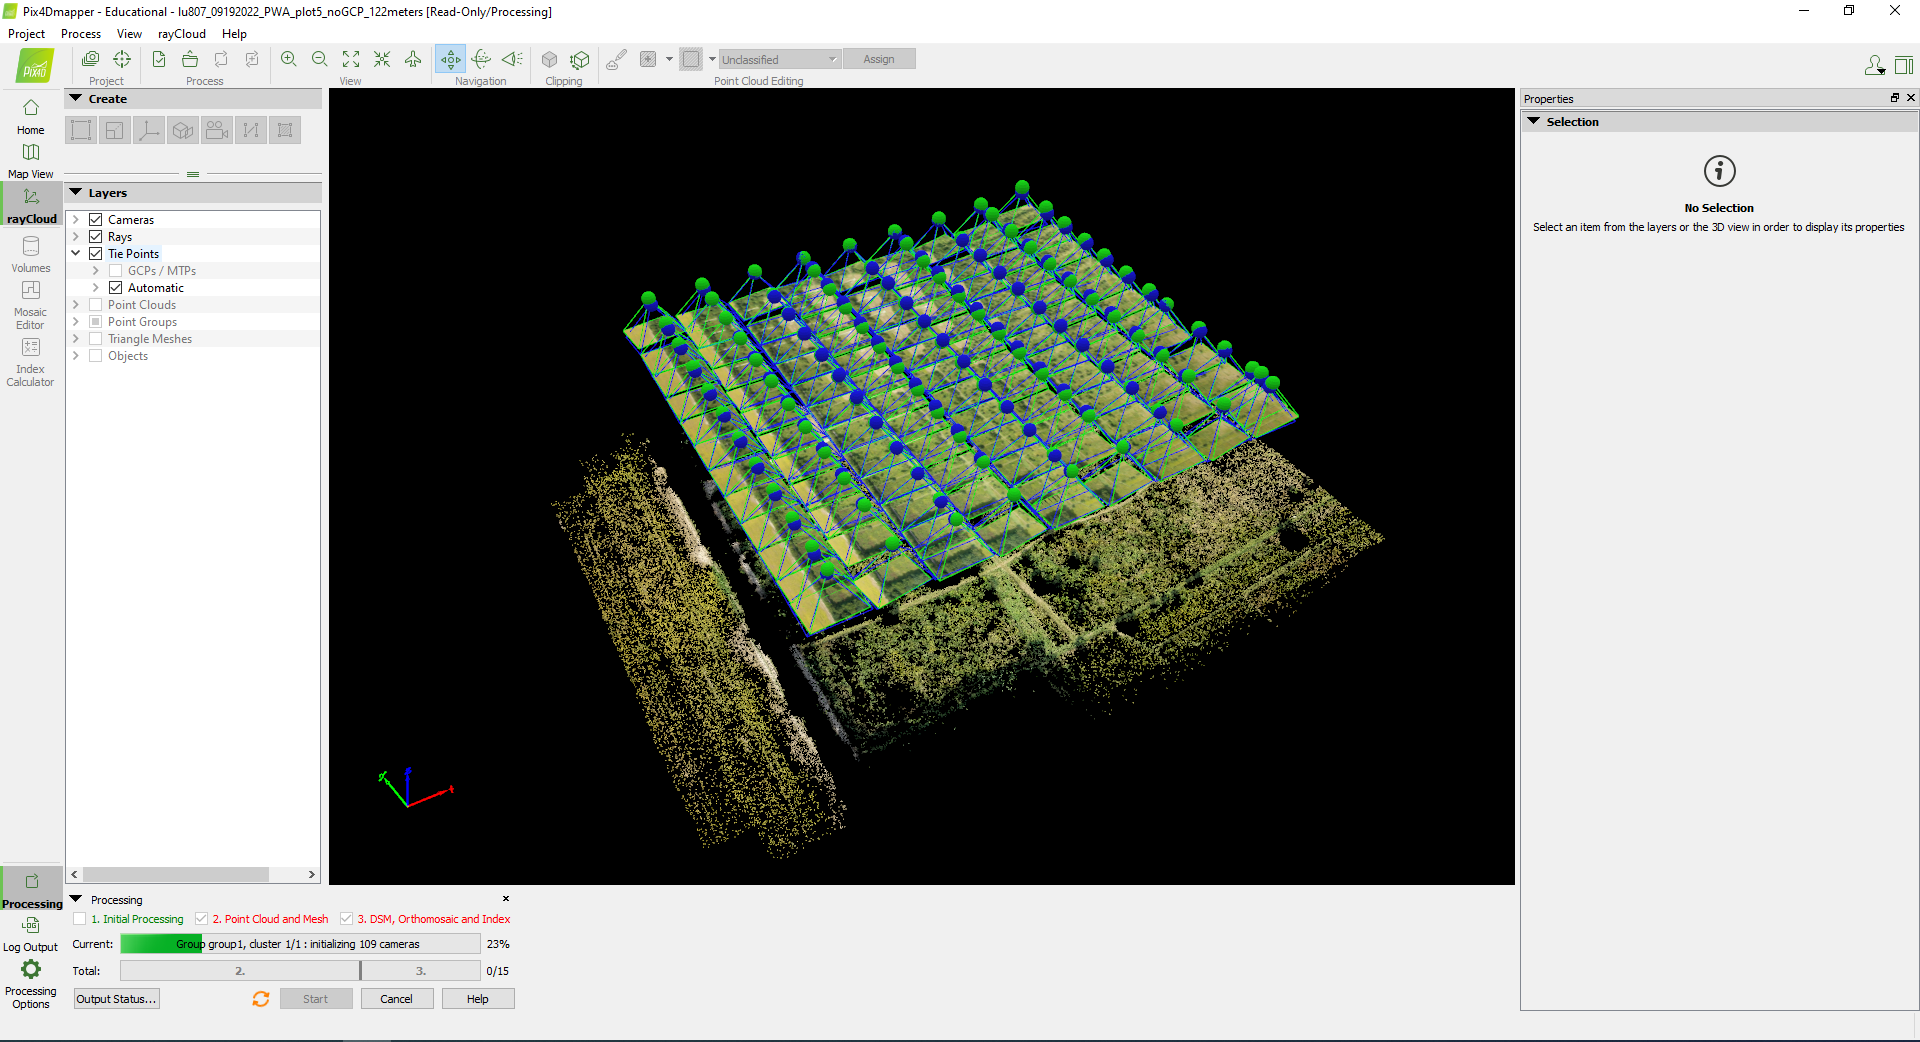
3. Uncheck 2 and 3 → Start.
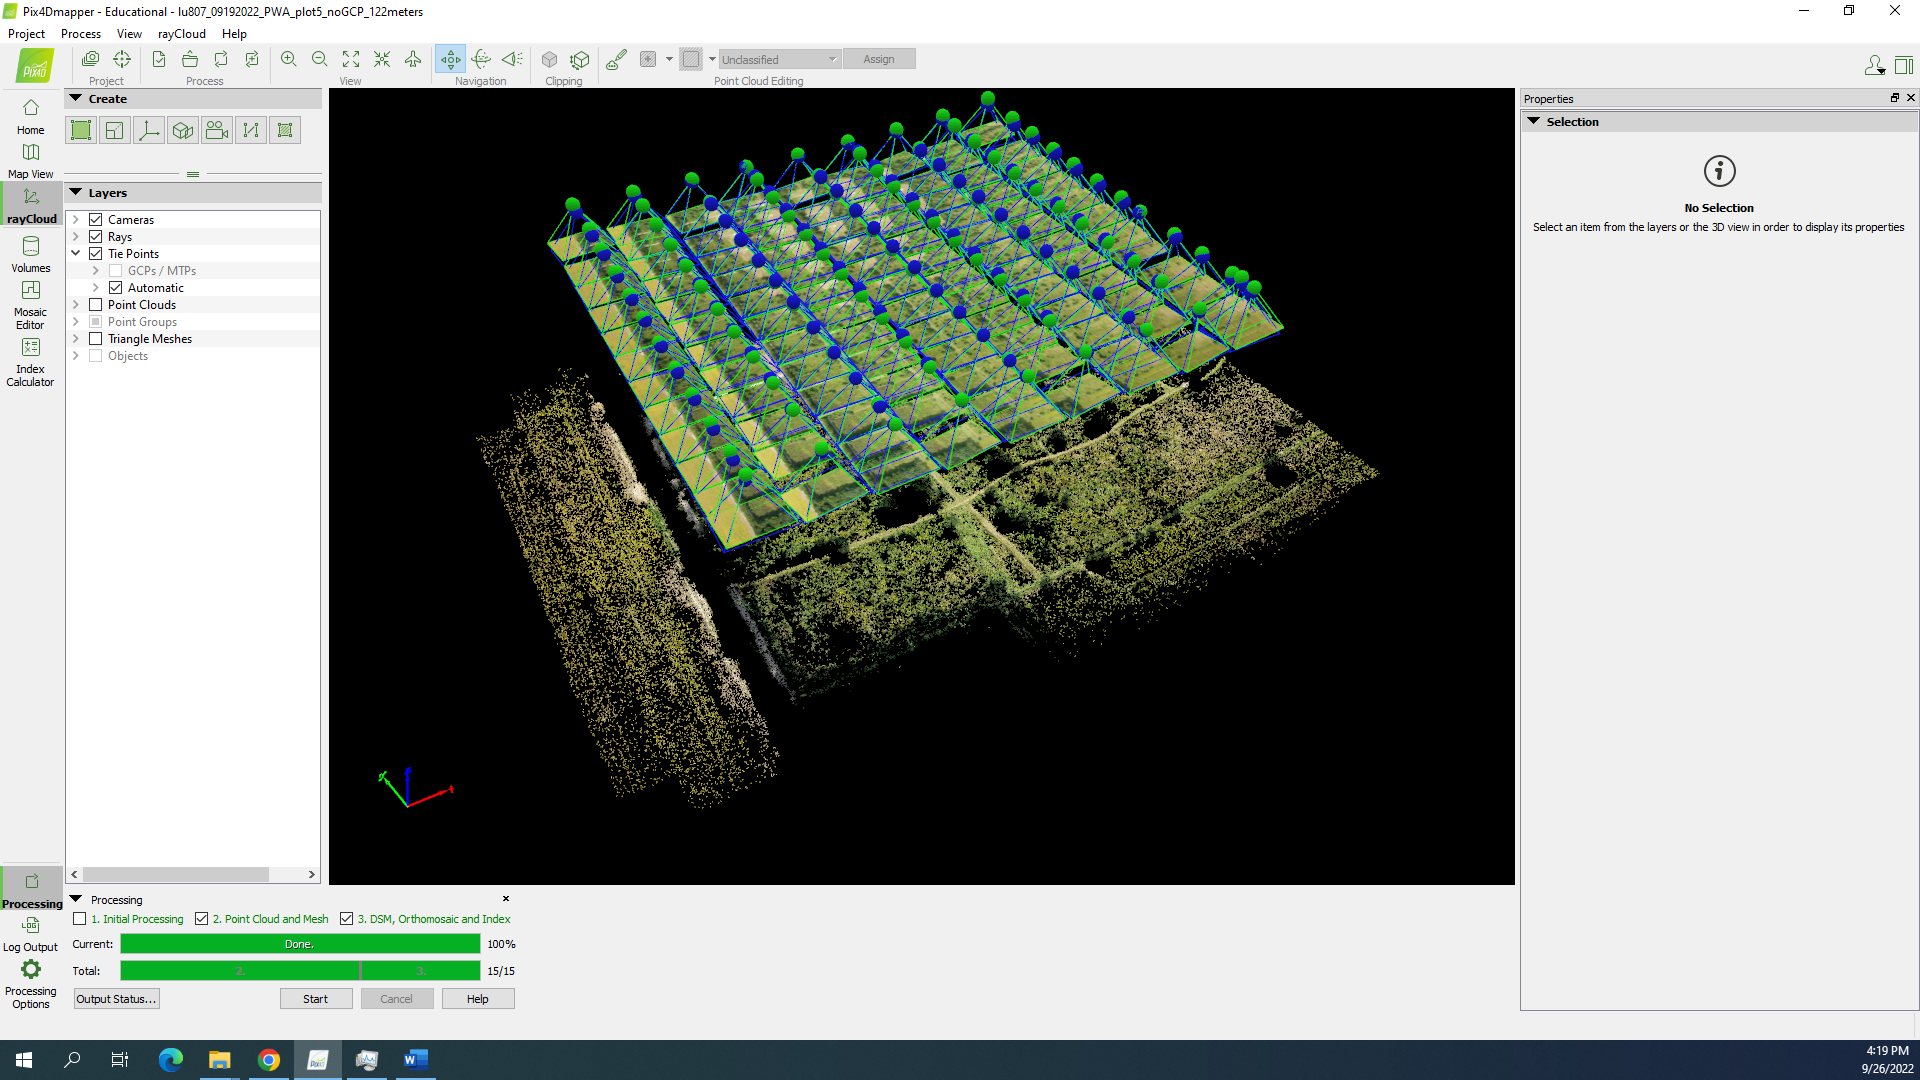
4. After Initial processing is finished, check if the image quality is good or not.
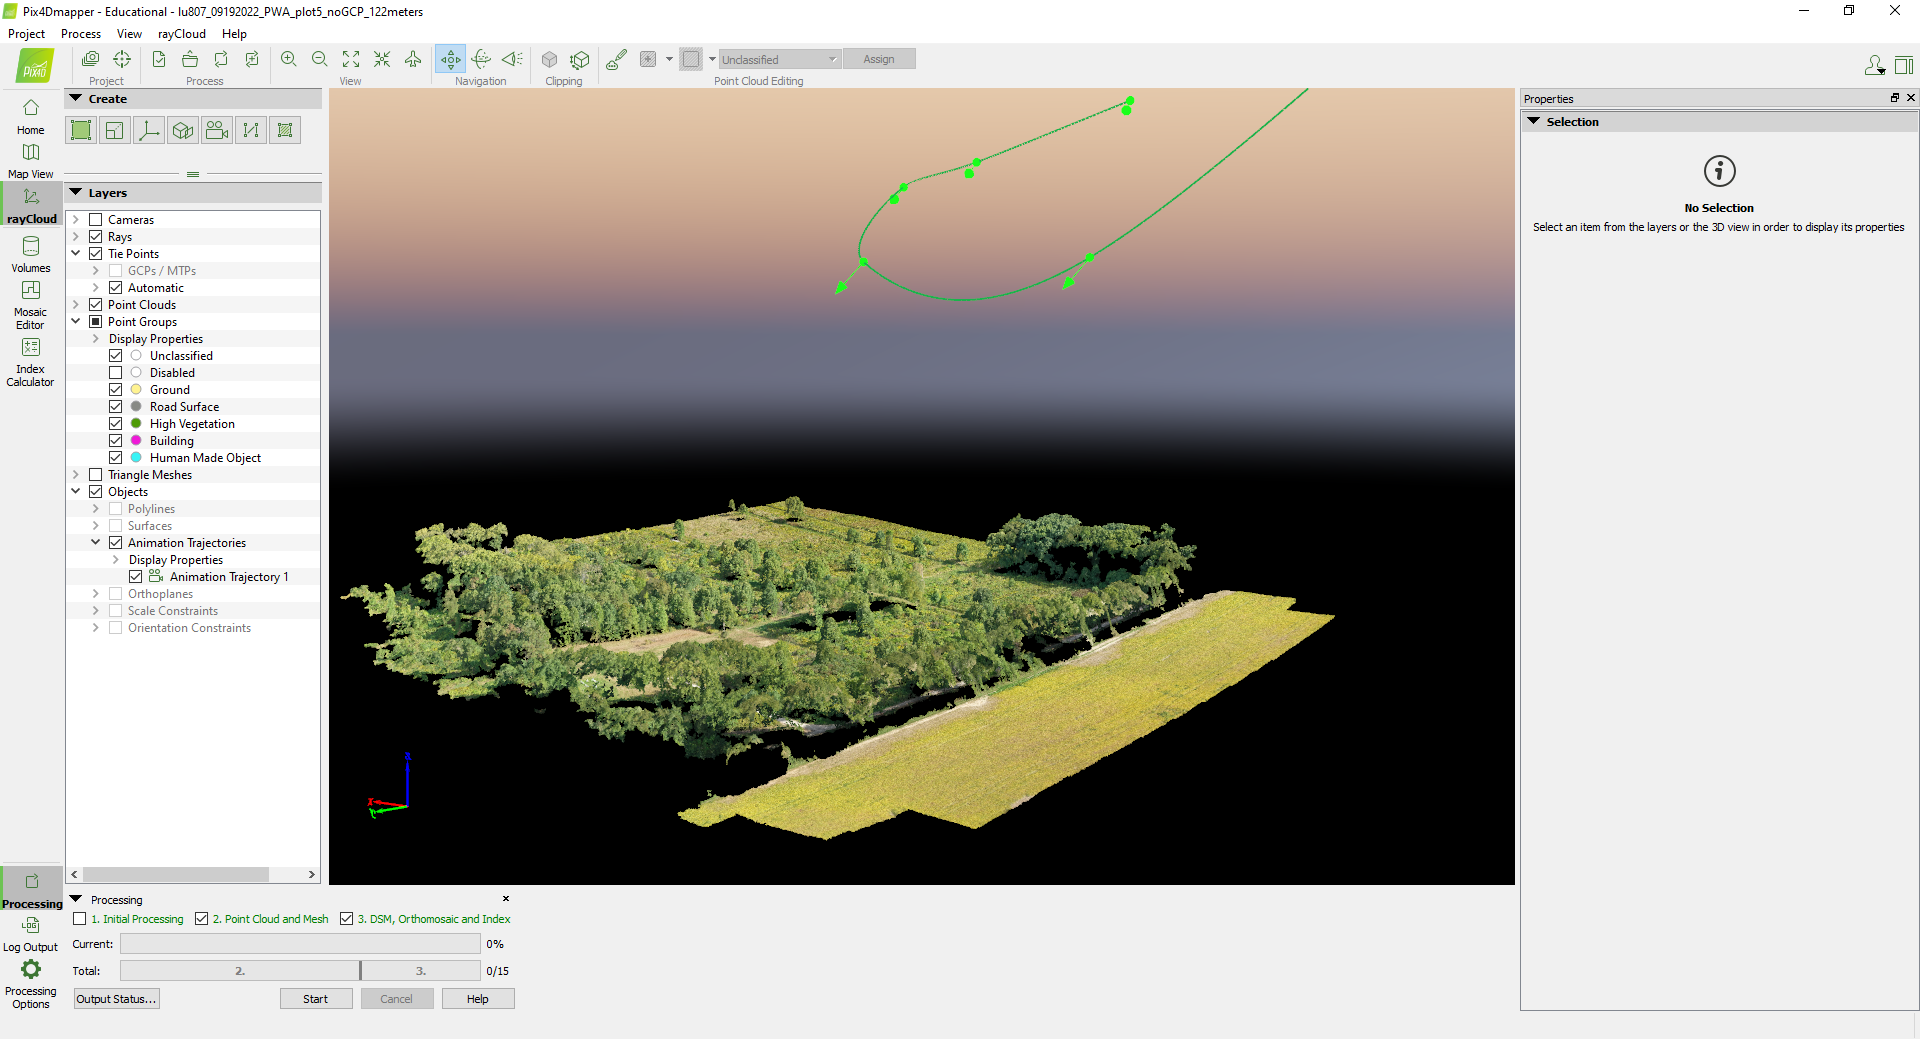
IV. Point Cloud and Mesh and DSM, Orthomosaic and Index
Uncheck 1, check 2 and 3 → Start.